


 文章介绍了在K8S服务部署后,如何通过日志系统监控服务运行情况,特别提到了两种实用的日志查看工具——Kubetail和Stern。Kubetail是一个简单的Shell脚本,能聚合多个Pod的日志并支持彩色输出和过滤,而Stern是Go语言开发的工具,具有相似功能。文章详细阐述了这两个工具的安装和使用方法。
通常情况下,在部署了 K8S 服务之后,为了更好地监控服务的运行情况,都会接入对应的日志系统来进行检测和分析,为了采集这些日志,需要在每个运行服务节点上部署一个日志采集 agent,并发送到集中式日志进行存储和处理。
容器的日志存储方式一般有以下几种:
1. 标准输出:容器可以将日志输出到标准输出(stdout)或标准错误输出(stderr),这些日志可以直接输出到控制台或者重定向到文件中。这种方式最简单、最常见,但是无法对日志进行分类和过滤,不适合在大规模环境中使用。
2. 容器日志文件:容器可以将日志输出到指定的日志文件中,这些日志文件可以在容器中使用类似 tail -f 的命令实时查看。这种方式可以将不同类型的日志记录到不同的文件中,方便管理和查询,但是需要注意日志文件的大小和数量,避免占用过多的存储空间。
3. 日志收集器:容器可以使用一些日志收集器(如Fluentd、Logstash等)来收集和处理容器日志,并将其发送到集中式日志系统中。这种方式可以将不同容器的日志集中起来,方便管理和分析。但是需要注意配置和管理日志收集器的复杂度。
4. 日志驱动程序:容器引擎(如Docker、Kubernetes等)提供了一些日志驱动程序(如json-file、syslog等),可以将容器日志输出到指定的目的地中。这种方式可以将日志发送到远程存储或者日志分析系统中,但是需要注意配置和管理日志驱动程序的复杂度。
而且,容器内部有 stdout、hostPath、emptyDir、pv 等存储方式,因此,今天就介绍两款超好用的多容器实时日志查看工具 Kubetail 和 Stern。
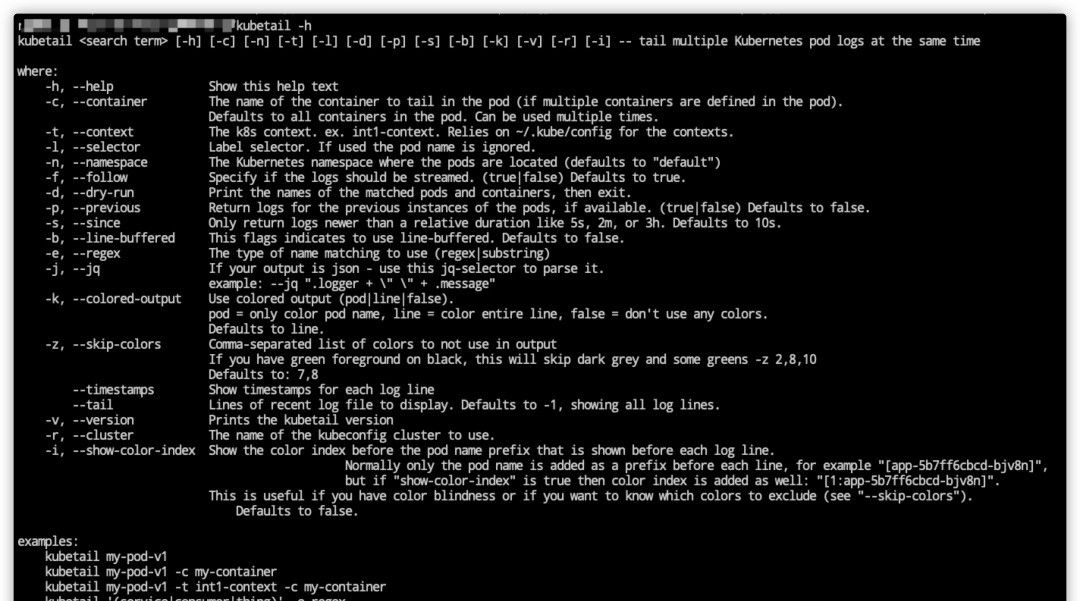
1. Kubetail 工具
Bash script to tail Kubernetes logs from multiple pods at the same time
Kubetail 项目其实是一个简单 Shell 脚本,它可以将多个 Pod 中的日志信息聚合到一起进行展示,并支持彩色输出和条件过滤。
查看K8S容器日志内容 - Kubetail
1.1 工具安装
安装非常简单,而且针对不同平台适配不同类型的工具。
-
Homebrew
# install kubetail using brew
$ brew tap johanhaleby/kubetail && brew install kubetail
-
Linux
# download and to go
# https://github.com/johanhaleby/kubetail/releases
$ wget https://raw.githubusercontent.com/johanhaleby/kubetail/master/kubetail
$ chmod +x kubetail
$ cp kubetail /usr/local/bin
-
zsh plugin
# oh-my-zsh
$ cd ~/.oh-my-zsh/custom/plugins/
$ git clone https://github.com/johanhaleby/kubetail.git kubetail

$ vim ~/.zshrc
plugins=( ... kubetail )

$ source ~/.zshrc
1.2 工具使用
使用起来也非常的简单,短短 2 分钟就可以上手!
-
示例说明前数据信息准备
# show all your pods
$ kubectl get pods -n test
NAME                   READY     STATUS    RESTARTS   AGE
app1-v1-aba8y          1/1       Running   0          1d
app1-v1-gc4st          1/1       Running   0          1d
app1-v1-m8acl          1/1       Running   0          6d
app1-v1-s20d0          1/1       Running   0          1d
app2-v31-9pbpn         1/1       Running   0          1d
app2-v31-q74wg         1/1       Running   0          1d
my-demo-v5-0fa8o       1/1       Running   0          3h
my-demo-v5-yhren       1/1       Running   0          2h
-
介绍了工具的使用方式
# 同时跟踪两个"app2"的Pod的日志
$ kubetail app2
$ kubetail app1,app2

# 指定"app2"的Pod里面的容器名称
$ kubetail app2 -c container1
$ kubetail app2 -c container1 -c container2
$ kubetail app2 -c container1 -n namespace1

# 使用正则表达式
$ kubetail "^app1|.*my-demo.*" --regex
-
通过使用
-k参数,您可以指定kubetail如何使用颜色
# pod:   只有Pod名称着色且其他输出均使用终端默认颜色
# line:  整行是彩色的(默认)
# false: 所有输出都不着色
$ kubetail app2 -k pod
$ kubetail app2 -k line
$ kubetail app2 -k false
-
常见命令行参数说明
| 编号 | 命令行参数 | 对应含义解析 |
|---|---|---|
| 1 | -n | 指定命名空间的名称 |
| 2 | -c | 指定多容器 Pod 中的容器具体名称 |
| 3 | -k | 将输出的日志内容进行着色显示 |
| 4 | -b | 是否使用 line-buffered 特性,默认为 false 状态 |
| 5 | -l | 标签过滤器,用于忽略 Pod 名称 |
| 6 | -t | 指定 Kubeconfig 文件中的 Context 内容 |
| 7 | -s | 指定返回一个相对时间之后的日志;例如 5s/2m/3h,默认是 10s |
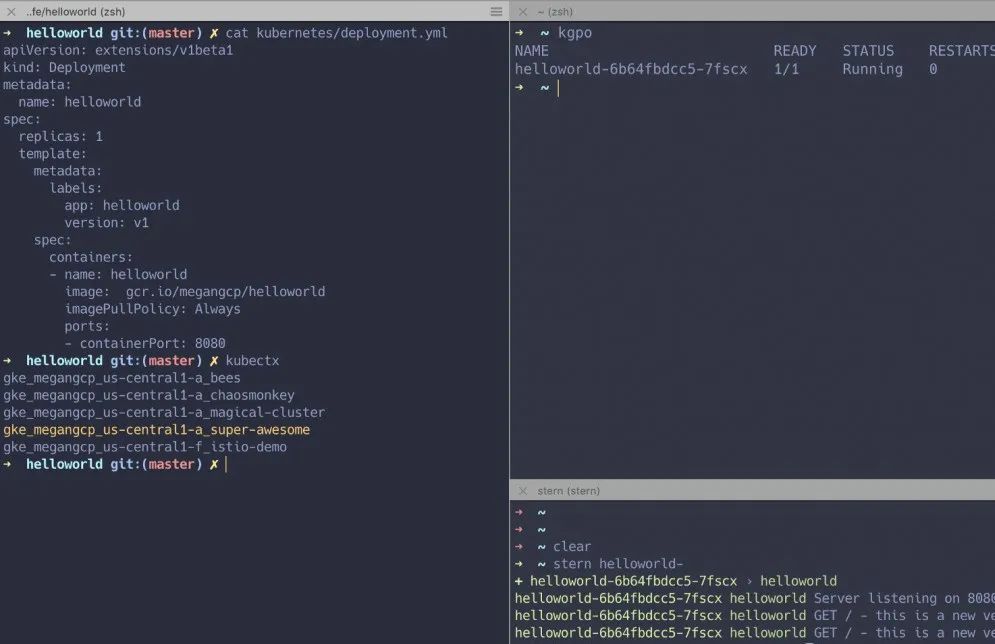
2. Stern 工具
Multi pod and container log tailing for Kubernetes
Stern 是使用 Go 语言开发的一款开箱即用的简单工具,它可以将多个 Pod 中的日志信息聚合到一起进行展示,并支持彩色输出和条件过滤。需要说的是,该工具已经很久都没有更新过了,所有不建议使用了。
2.1 工具安装
安装非常简单,而且针对不同平台适配不同类型的工具。
-
Homebrew
# install kubetail using brew
$ brew install stern
-
Linux
# download and to go
# https://github.com/wercker/stern/tags
$ wget https://github.com/wercker/stern/releases/download/1.11.0/stern_linux_amd64
$ chmod +x stern_linux_amd64
$ mv stern_linux_amd64 /usr/local/bin
-
zsh plugin
# bash-completion
$ brew install bash-completion
$ source <(brew --prefix)/etc/bash-completion
$ source <(stern --completion=bash)

# .zshrc
$ source <(stern --completion=zsh)
2.2 工具使用
使用起来也非常的简单,短短 2 分钟就可以上手!
-
示例说明前数据信息准备
# show all your pods
$ kubectl get pods -n test
NAME                   READY     STATUS    RESTARTS   AGE
app1-v1-aba8y          1/1       Running   0          1d
app1-v1-gc4st          1/1       Running   0          1d
app1-v1-m8acl          1/1       Running   0          6d
app1-v1-s20d0          1/1       Running   0          1d
app2-v31-9pbpn         1/1       Running   0          1d
app2-v31-q74wg         1/1       Running   0          1d
my-demo-v5-0fa8o       1/1       Running   0          3h
my-demo-v5-yhren       1/1       Running   0          2h
-
介绍了工具的使用方式
# 查看默认名称空间下的所有Pod日志
$ stern  .

# 查看 Pod 中指定容器的日志
$ stern app2 --container container1

# 查看指定命名空间中容器的日志
$ stern app2 --namespace namespace1

# 查看指定命名空间中除指定容器外的所有容器的日志
$ stern --namespace namespace1 --exclude-container container1 .

# 查看指定时间范围内容器的日志(15分钟内)
$ stern app2 -t --since 15m

# 查看所有命名空间中符合指定标签容器的日志
$ stern --all-namespaces -l run=nginx

# 查找前端Pod中版本为canary的日志
$ stern frontend --selector release=canary

# 将日志消息通过管道传输到jq命令
$ stern backend -o json | jq .

# 仅输出日志消息本身
$ stern backend -o raw

# 使用自定义模板输出
$ stern --template '{{.Message}} ({{.Namespace}}/{{.PodName}}/{{.ContainerName}})' backend

# 使用stern提供的颜色的自定义模板输出
$ stern --template '{{.Message}} ({{.Namespace}}/{{color .PodColor .PodName}}/{{color .ContainerColor .ContainerName}})' backend
-
常见命令行参数说明
| flag | default | purpose |
|---|---|---|
--container | .* | Container name when multiple containers in pod (regular expression) |
--exclude-container | Container name to exclude when multiple containers in pod (regular expression) | |
--container-state | running | Tail containers with status in running, waiting or terminated. Default to running. |
--timestamps | Print timestamps | |
--since | Return logs newer than a relative duration like 52, 2m, or 3h. Displays all if omitted | |
--context | Kubernetes context to use. Default to kubectl config current-context | |
--exclude | Log lines to exclude; specify multiple with additional --exclude; (regular expression) | |
--namespace | Kubernetes namespace to use. Default to namespace configured in Kubernetes context | |
--kubeconfig | ~/.kube/config | Path to kubeconfig file to use |
--all-namespaces | If present, tail across all namespaces. A specific namespace is ignored even if specified with –namespace. | |
--selector | Selector (label query) to filter on. If present, default to .* for the pod-query. | |
--tail | -1 | The number of lines from the end of the logs to show. Defaults to -1, showing all logs. |
--color | auto | Force set color output. auto: colorize if tty attached, always: always colorize, never: never colorize |
--output | default | Specify predefined template. Currently support: [default, raw, json] See templates section |
template | Template to use for log lines, leave empty to use –output flag |
3. 参考链接地址
-
johanhaleby/kubetail
-
wercker/stern
-
两款超好用的 Kubernetes 实时日志查看工具


 4万+
4万+

 被折叠的 条评论
为什么被折叠?
被折叠的 条评论
为什么被折叠?
 到【灌水乐园】发言


