


0. 资料
Intel-Pin的官方下载地址:https://www.intel.cn/content/www/cn/zh/developer/articles/tool/pin-a-binary-instrumentation-tool-downloads.html
概述文档:https://www.intel.cn/content/www/cn/zh/developer/articles/tool/pin-a-dynamic-binary-instrumentation-tool.html
用户手册:https://software.intel.com/sites/landingpage/pintool/docs/98749/Pin/doc/html/index.html (版本号可能会更新,请注意)
问题讨论:https://groups.io/g/pinheads
1. 下载
Intel PIN是一款由Intel公司开发的动态二进制分析框架,主要用于构建程序分析工具。目前该框架并未开源,所以没有相关的源代码,但intel提供了编译发行版本,我们用这个编译版本即可。
前往 https://www.intel.cn/content/www/cn/zh/developer/articles/tool/pin-a-binary-instrumentation-tool-downloads.html 下载
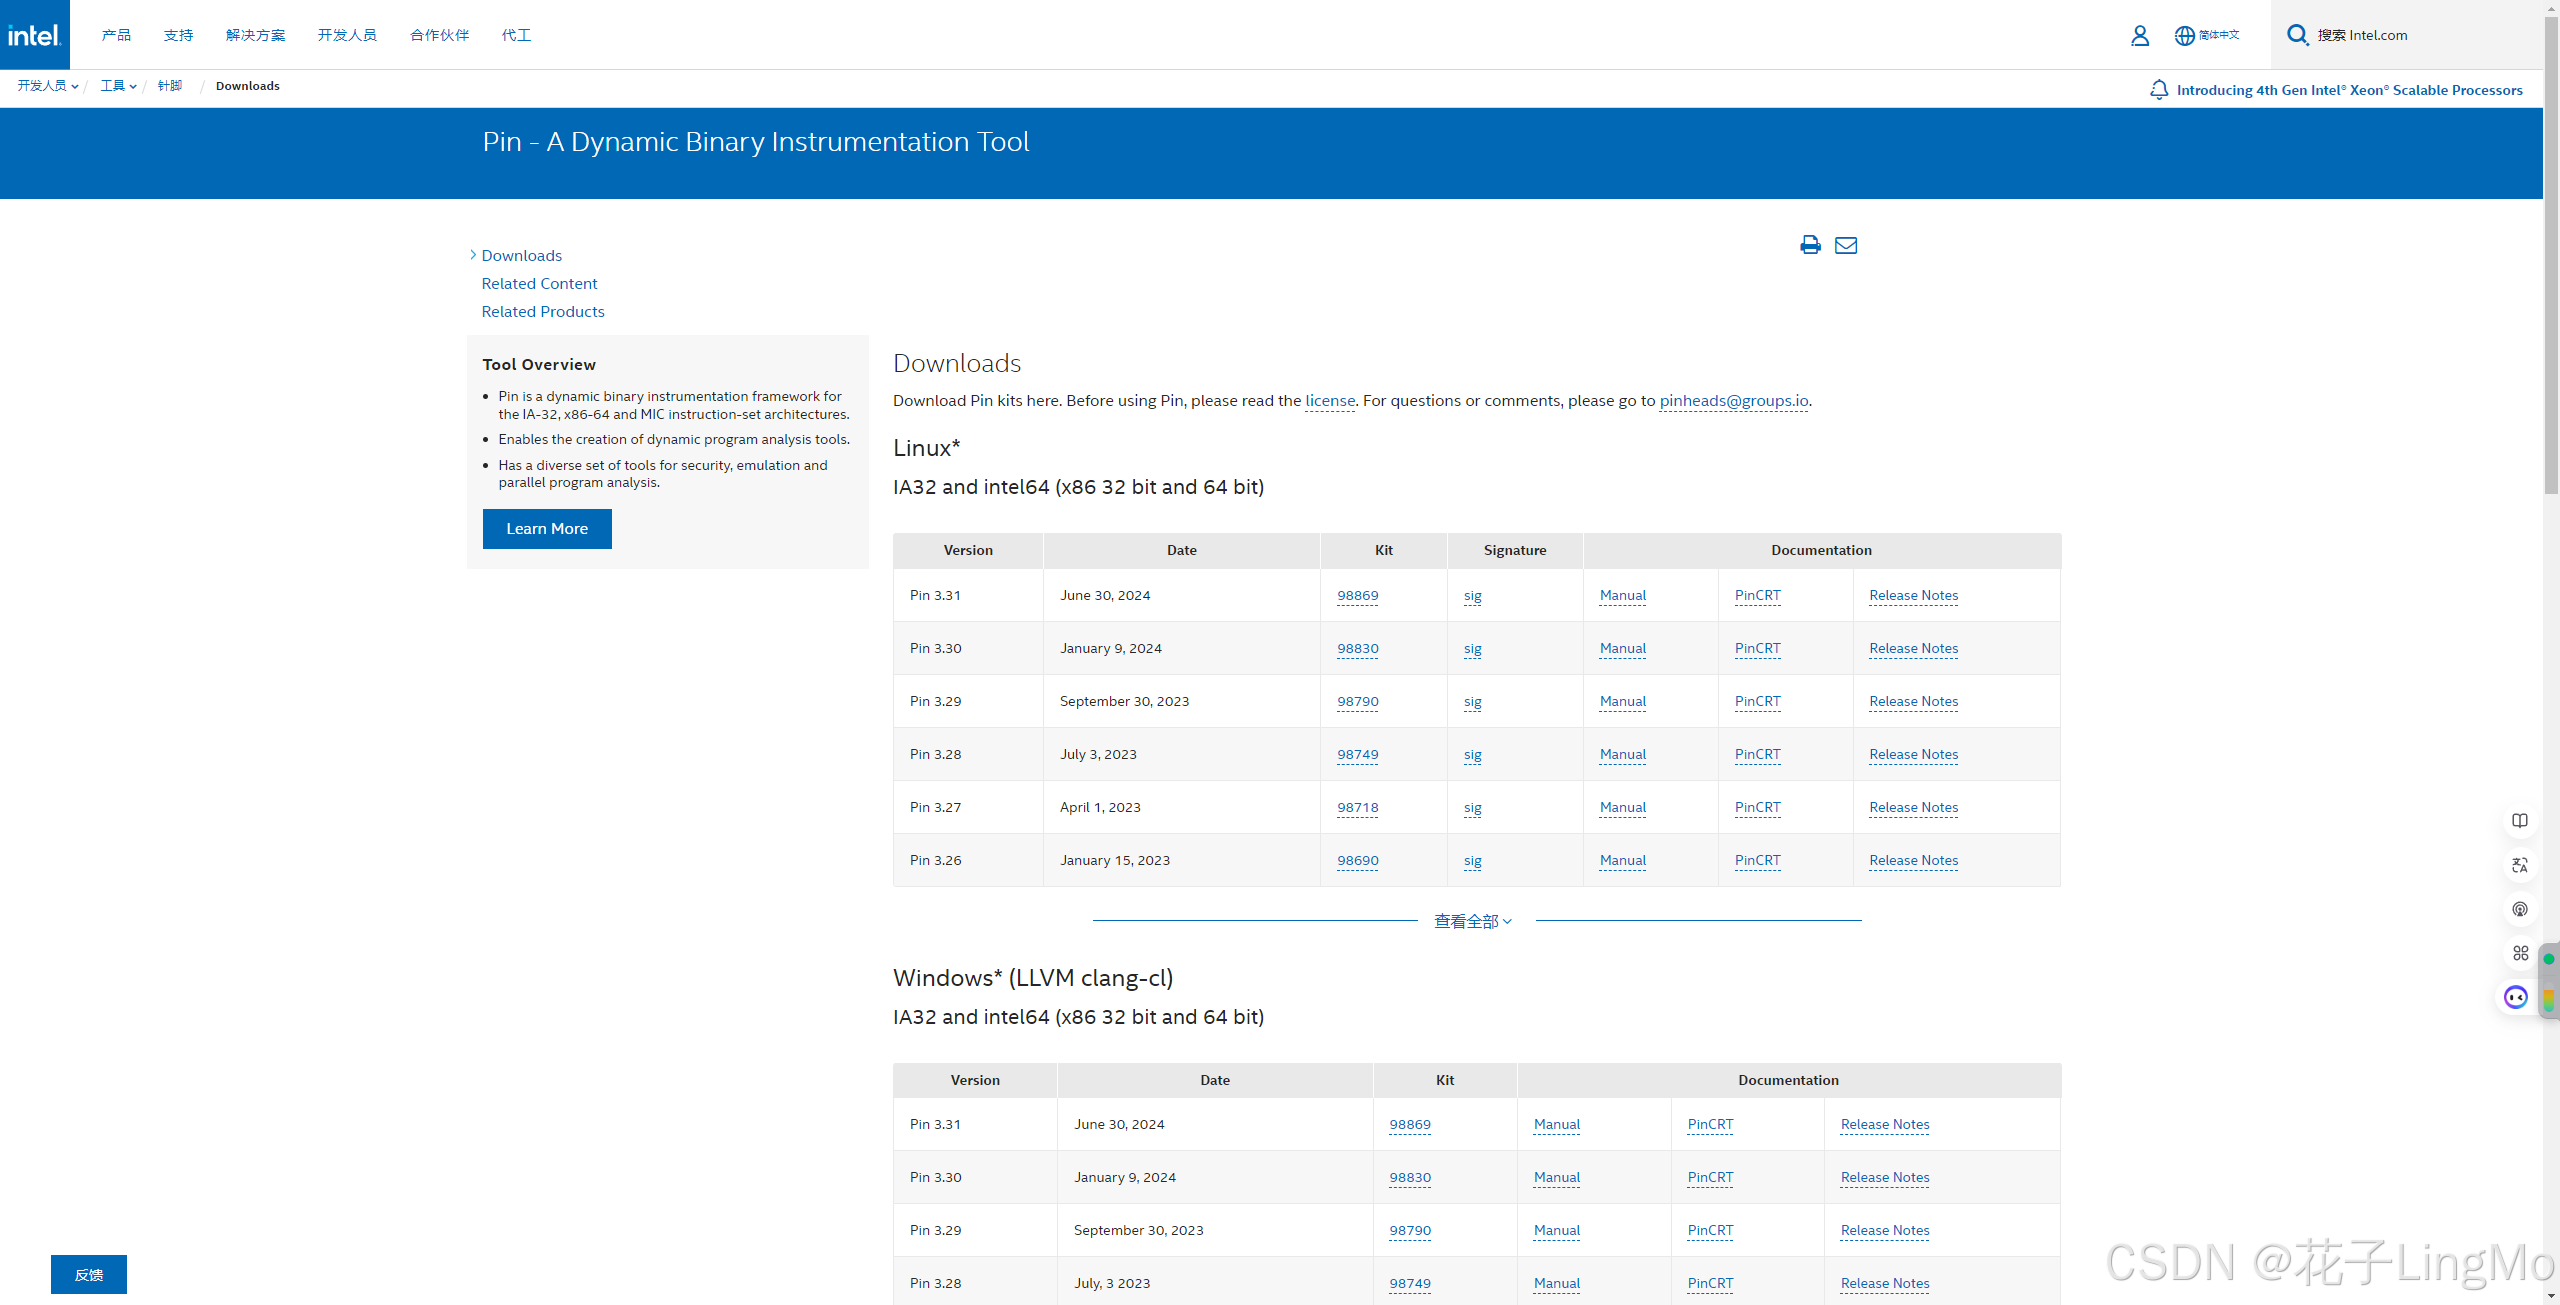
因为我们是在Windows平台上使用pin,并且打算用visual studio来编写代码,所以我们拉到中间,找到 Windows* (MSVC)
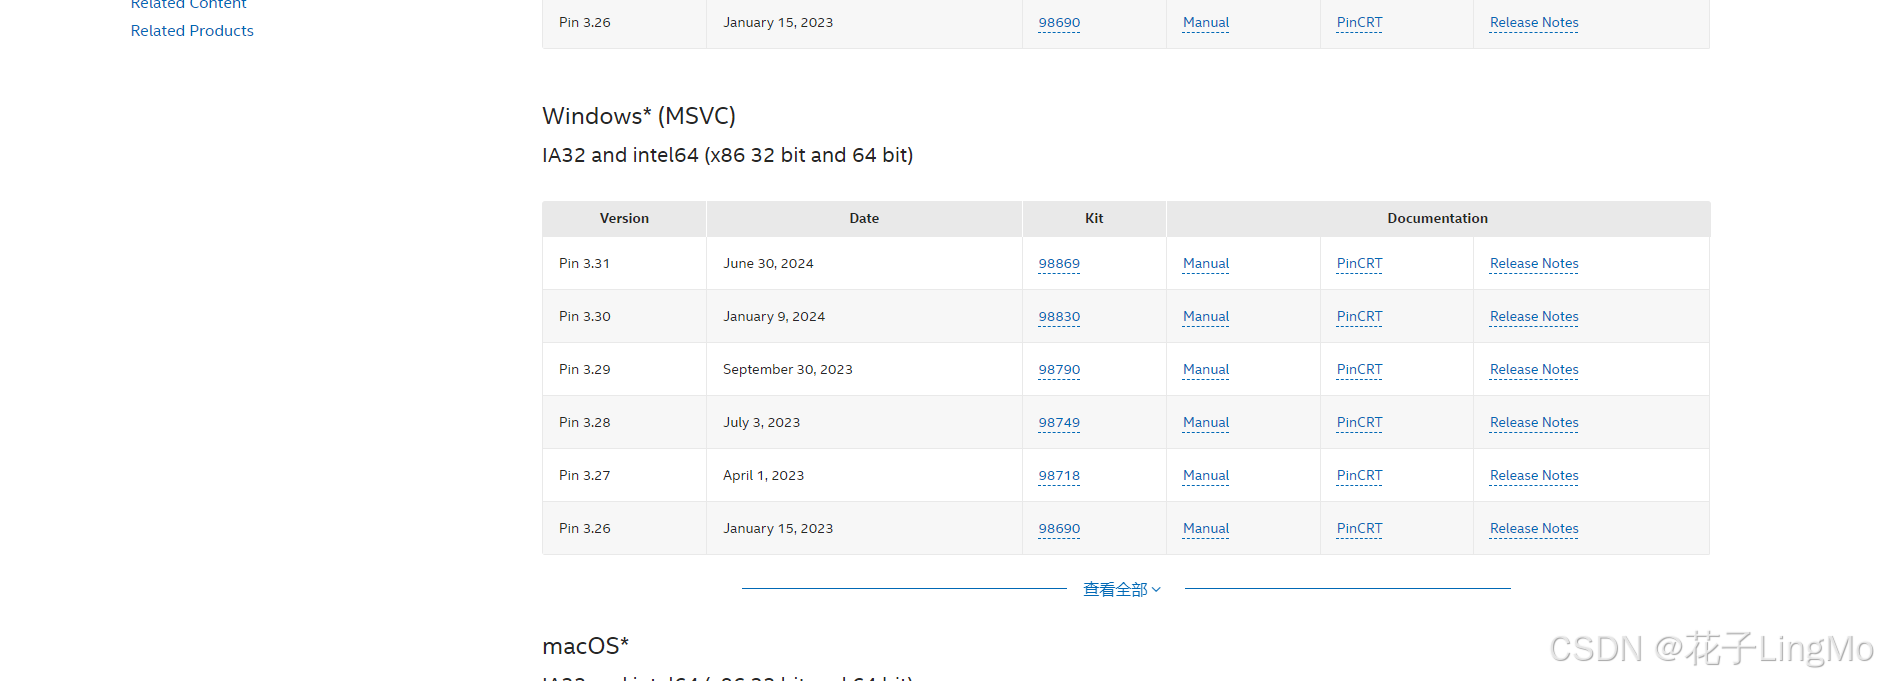
直接下载最新版本即可,点击"Kit"并等待下载完成。
下载完成后我们打开压缩包:
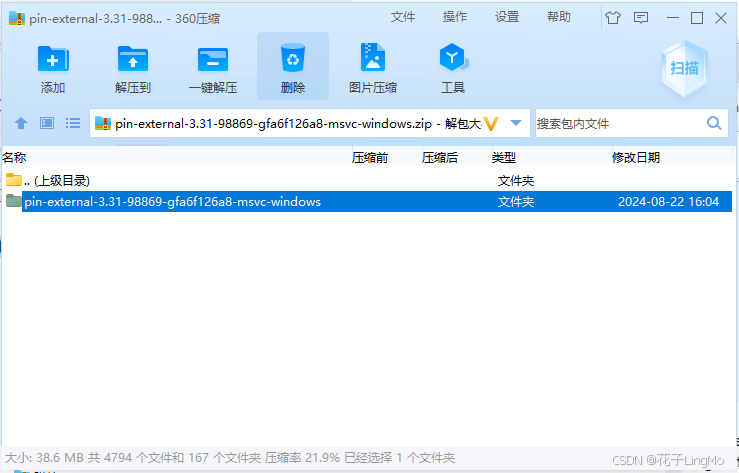
直接解压出来
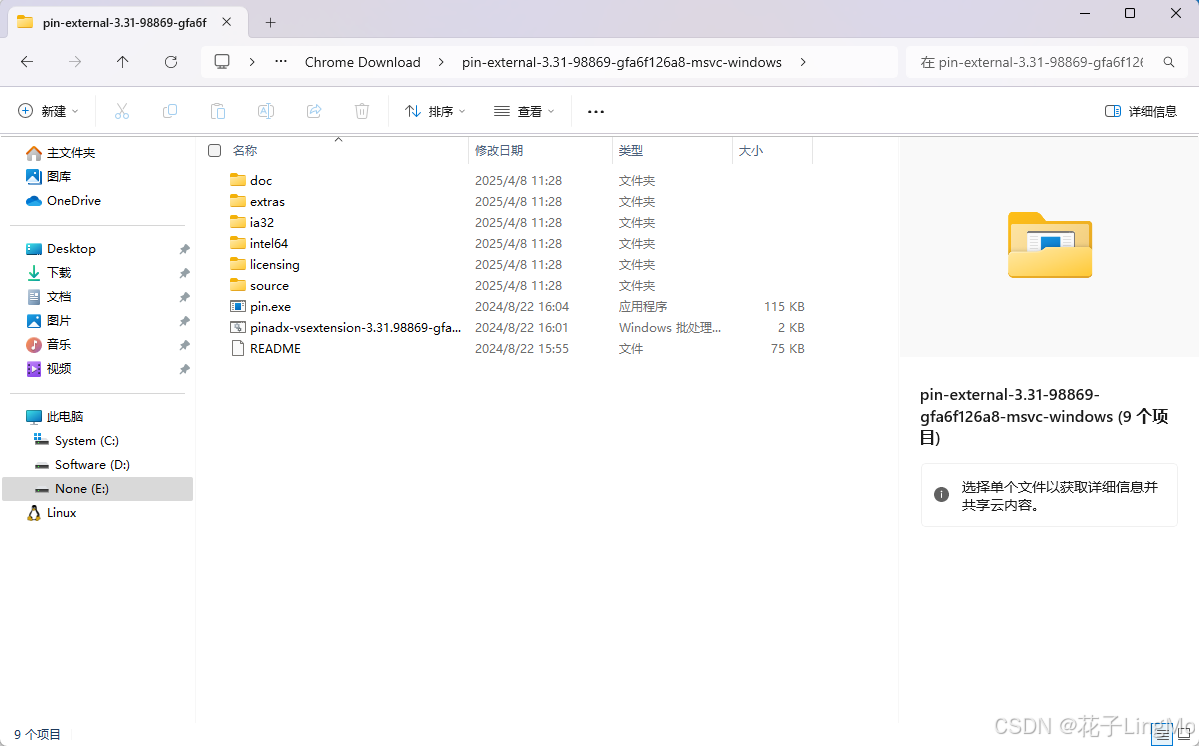
可以注意到,解压后的根目录有一个 pin.exe 程序,这个程序就是我们用pin的关键了,这时候你可以在环境变量中添加路径,方便在cmd中使用pin。
2. 编译一个 pintool
pintool也是我们用pin的一个关键,我们所有的探针代码都在这里编写,intel官方已经给我们提供了模板,就在source\tools\MyPinTool这个目录。以后我们要写代码,就直接从这个模板开始写了
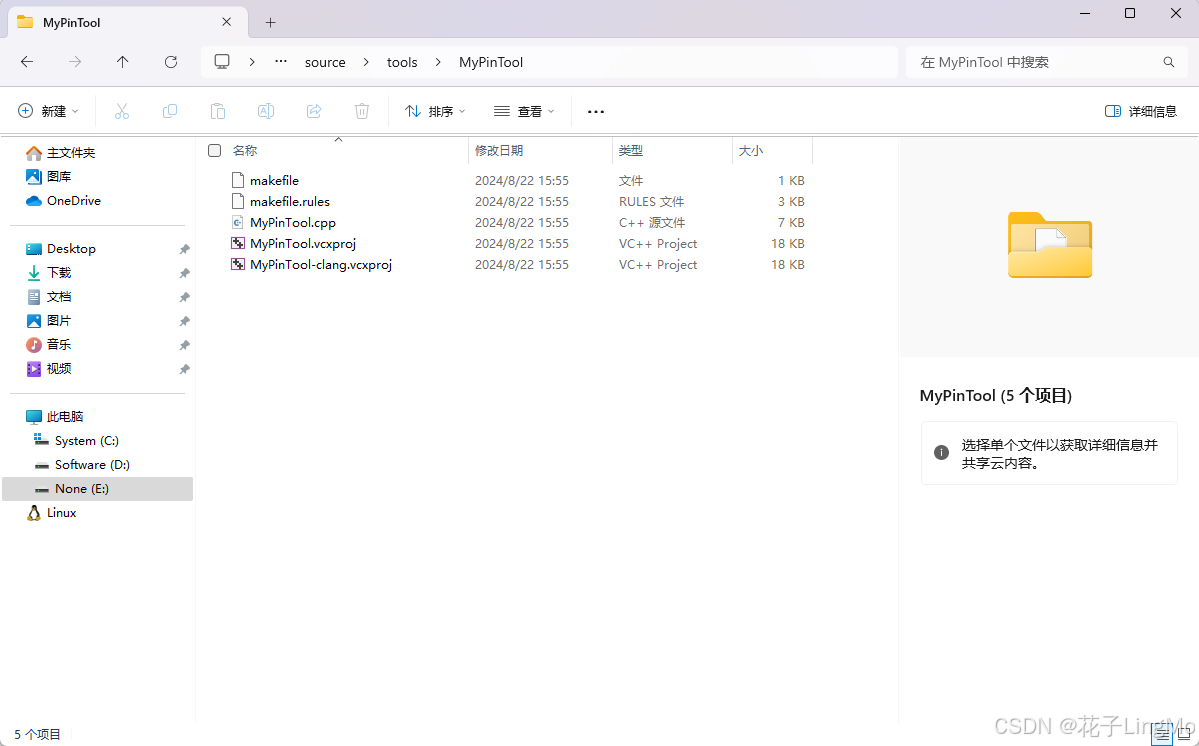
/*      MyPinTool.cpp      */
/*
 * Copyright (C) 2007-2023 Intel Corporation.
 * SPDX-License-Identifier: MIT
 */

/*! @file
 *  This is an example of the PIN tool that demonstrates some basic PIN APIs
 *  and could serve as the starting point for developing your first PIN tool
 */

#include "pin.H"
#include <iostream>
#include <fstream>
using std::cerr;
using std::endl;
using std::string;

/* ================================================================== */
// Global variables
/* ================================================================== */

UINT64 insCount    = 0; //number of dynamically executed instructions
UINT64 bblCount    = 0; //number of dynamically executed basic blocks
UINT64 threadCount = 0; //total number of threads, including main thread

std::ostream* out = &cerr;

/* ===================================================================== */
// Command line switches
/* ===================================================================== */
KNOB< string > KnobOutputFile(KNOB_MODE_WRITEONCE, "pintool", "o", "", "specify file name for MyPinTool output");

KNOB< BOOL > KnobCount(KNOB_MODE_WRITEONCE, "pintool", "count", "1",
                       "count instructions, basic blocks and threads in the application");

/* ===================================================================== */
// Utilities
/* ===================================================================== */

/*!
 *  Print out help message.
 */
INT32 Usage()
{
    cerr << "This tool prints out the number of dynamically executed " << endl
         << "instructions, basic blocks and threads in the application." << endl
         << endl;

    cerr << KNOB_BASE::StringKnobSummary() << endl;

    return -1;
}

/* ===================================================================== */
// Analysis routines
/* ===================================================================== */

/*!
 * Increase counter of the executed basic blocks and instructions.
 * This function is called for every basic block when it is about to be executed.
 * @param[in]   numInstInBbl    number of instructions in the basic block
 * @note use atomic operations for multi-threaded applications
 */
VOID CountBbl(UINT32 numInstInBbl)
{
    bblCount++;
    insCount += numInstInBbl;
}

/* ===================================================================== */
// Instrumentation callbacks
/* ===================================================================== */

/*!
 * Insert call to the CountBbl() analysis routine before every basic block
 * of the trace.
 * This function is called every time a new trace is encountered.
 * @param[in]   trace    trace to be instrumented
 * @param[in]   v        value specified by the tool in the TRACE_AddInstrumentFunction
 *                       function call
 */
VOID Trace(TRACE trace, VOID* v)
{
    // Visit every basic block in the trace
    for (BBL bbl = TRACE_BblHead(trace); BBL_Valid(bbl); bbl = BBL_Next(bbl))
    {
        // Insert a call to CountBbl() before every basic bloc, passing the number of instructions
        BBL_InsertCall(bbl, IPOINT_BEFORE, (AFUNPTR)CountBbl, IARG_UINT32, BBL_NumIns(bbl), IARG_END);
    }
}

/*!
 * Increase counter of threads in the application.
 * This function is called for every thread created by the application when it is
 * about to start running (including the root thread).
 * @param[in]   threadIndex     ID assigned by PIN to the new thread
 * @param[in]   ctxt            initial register state for the new thread
 * @param[in]   flags           thread creation flags (OS specific)
 * @param[in]   v               value specified by the tool in the
 *                              PIN_AddThreadStartFunction function call
 */
VOID ThreadStart(THREADID threadIndex, CONTEXT* ctxt, INT32 flags, VOID* v) { threadCount++; }

/*!
 * Print out analysis results.
 * This function is called when the application exits.
 * @param[in]   code            exit code of the application
 * @param[in]   v               value specified by the tool in the
 *                              PIN_AddFiniFunction function call
 */
VOID Fini(INT32 code, VOID* v)
{
    *out << "===============================================" << endl;
    *out << "MyPinTool analysis results: " << endl;
    *out << "Number of instructions: " << insCount << endl;
    *out << "Number of basic blocks: " << bblCount << endl;
    *out << "Number of threads: " << threadCount << endl;
    *out << "===============================================" << endl;
}

/*!
 * The main procedure of the tool.
 * This function is called when the application image is loaded but not yet started.
 * @param[in]   argc            total number of elements in the argv array
 * @param[in]   argv            array of command line arguments,
 *                              including pin -t <toolname> -- ...
 */
int main(int argc, char* argv[])
{
    // Initialize PIN library. Print help message if -h(elp) is specified
    // in the command line or the command line is invalid
    if (PIN_Init(argc, argv))
    {
        return Usage();
    }

    string fileName = KnobOutputFile.Value();

    if (!fileName.empty())
    {
        out = new std::ofstream(fileName.c_str());
    }

    if (KnobCount)
    {
        // Register function to be called to instrument traces
        TRACE_AddInstrumentFunction(Trace, 0);

        // Register function to be called for every thread before it starts running
        PIN_AddThreadStartFunction(ThreadStart, 0);

        // Register function to be called when the application exits
        PIN_AddFiniFunction(Fini, 0);
    }

    cerr << "===============================================" << endl;
    cerr << "This application is instrumented by MyPinTool" << endl;
    if (!KnobOutputFile.Value().empty())
    {
        cerr << "See file " << KnobOutputFile.Value() << " for analysis results" << endl;
    }
    cerr << "===============================================" << endl;

    // Start the program, never returns
    PIN_StartProgram();

    return 0;
}

/* ===================================================================== */
/* eof */
/* ===================================================================== */
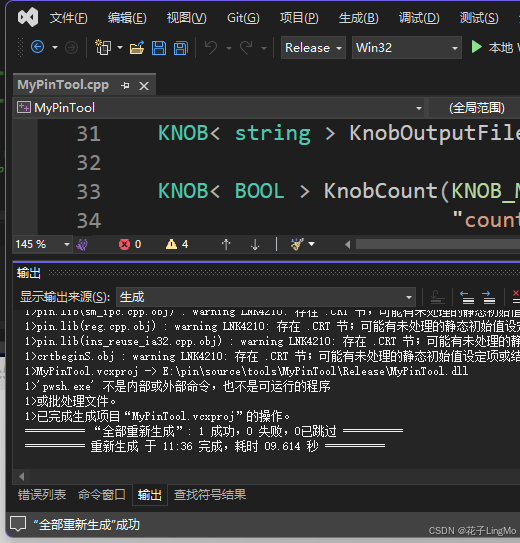
这里有一个vcxproj项目文件,我们直接在vs的解决方案中添加项目即可
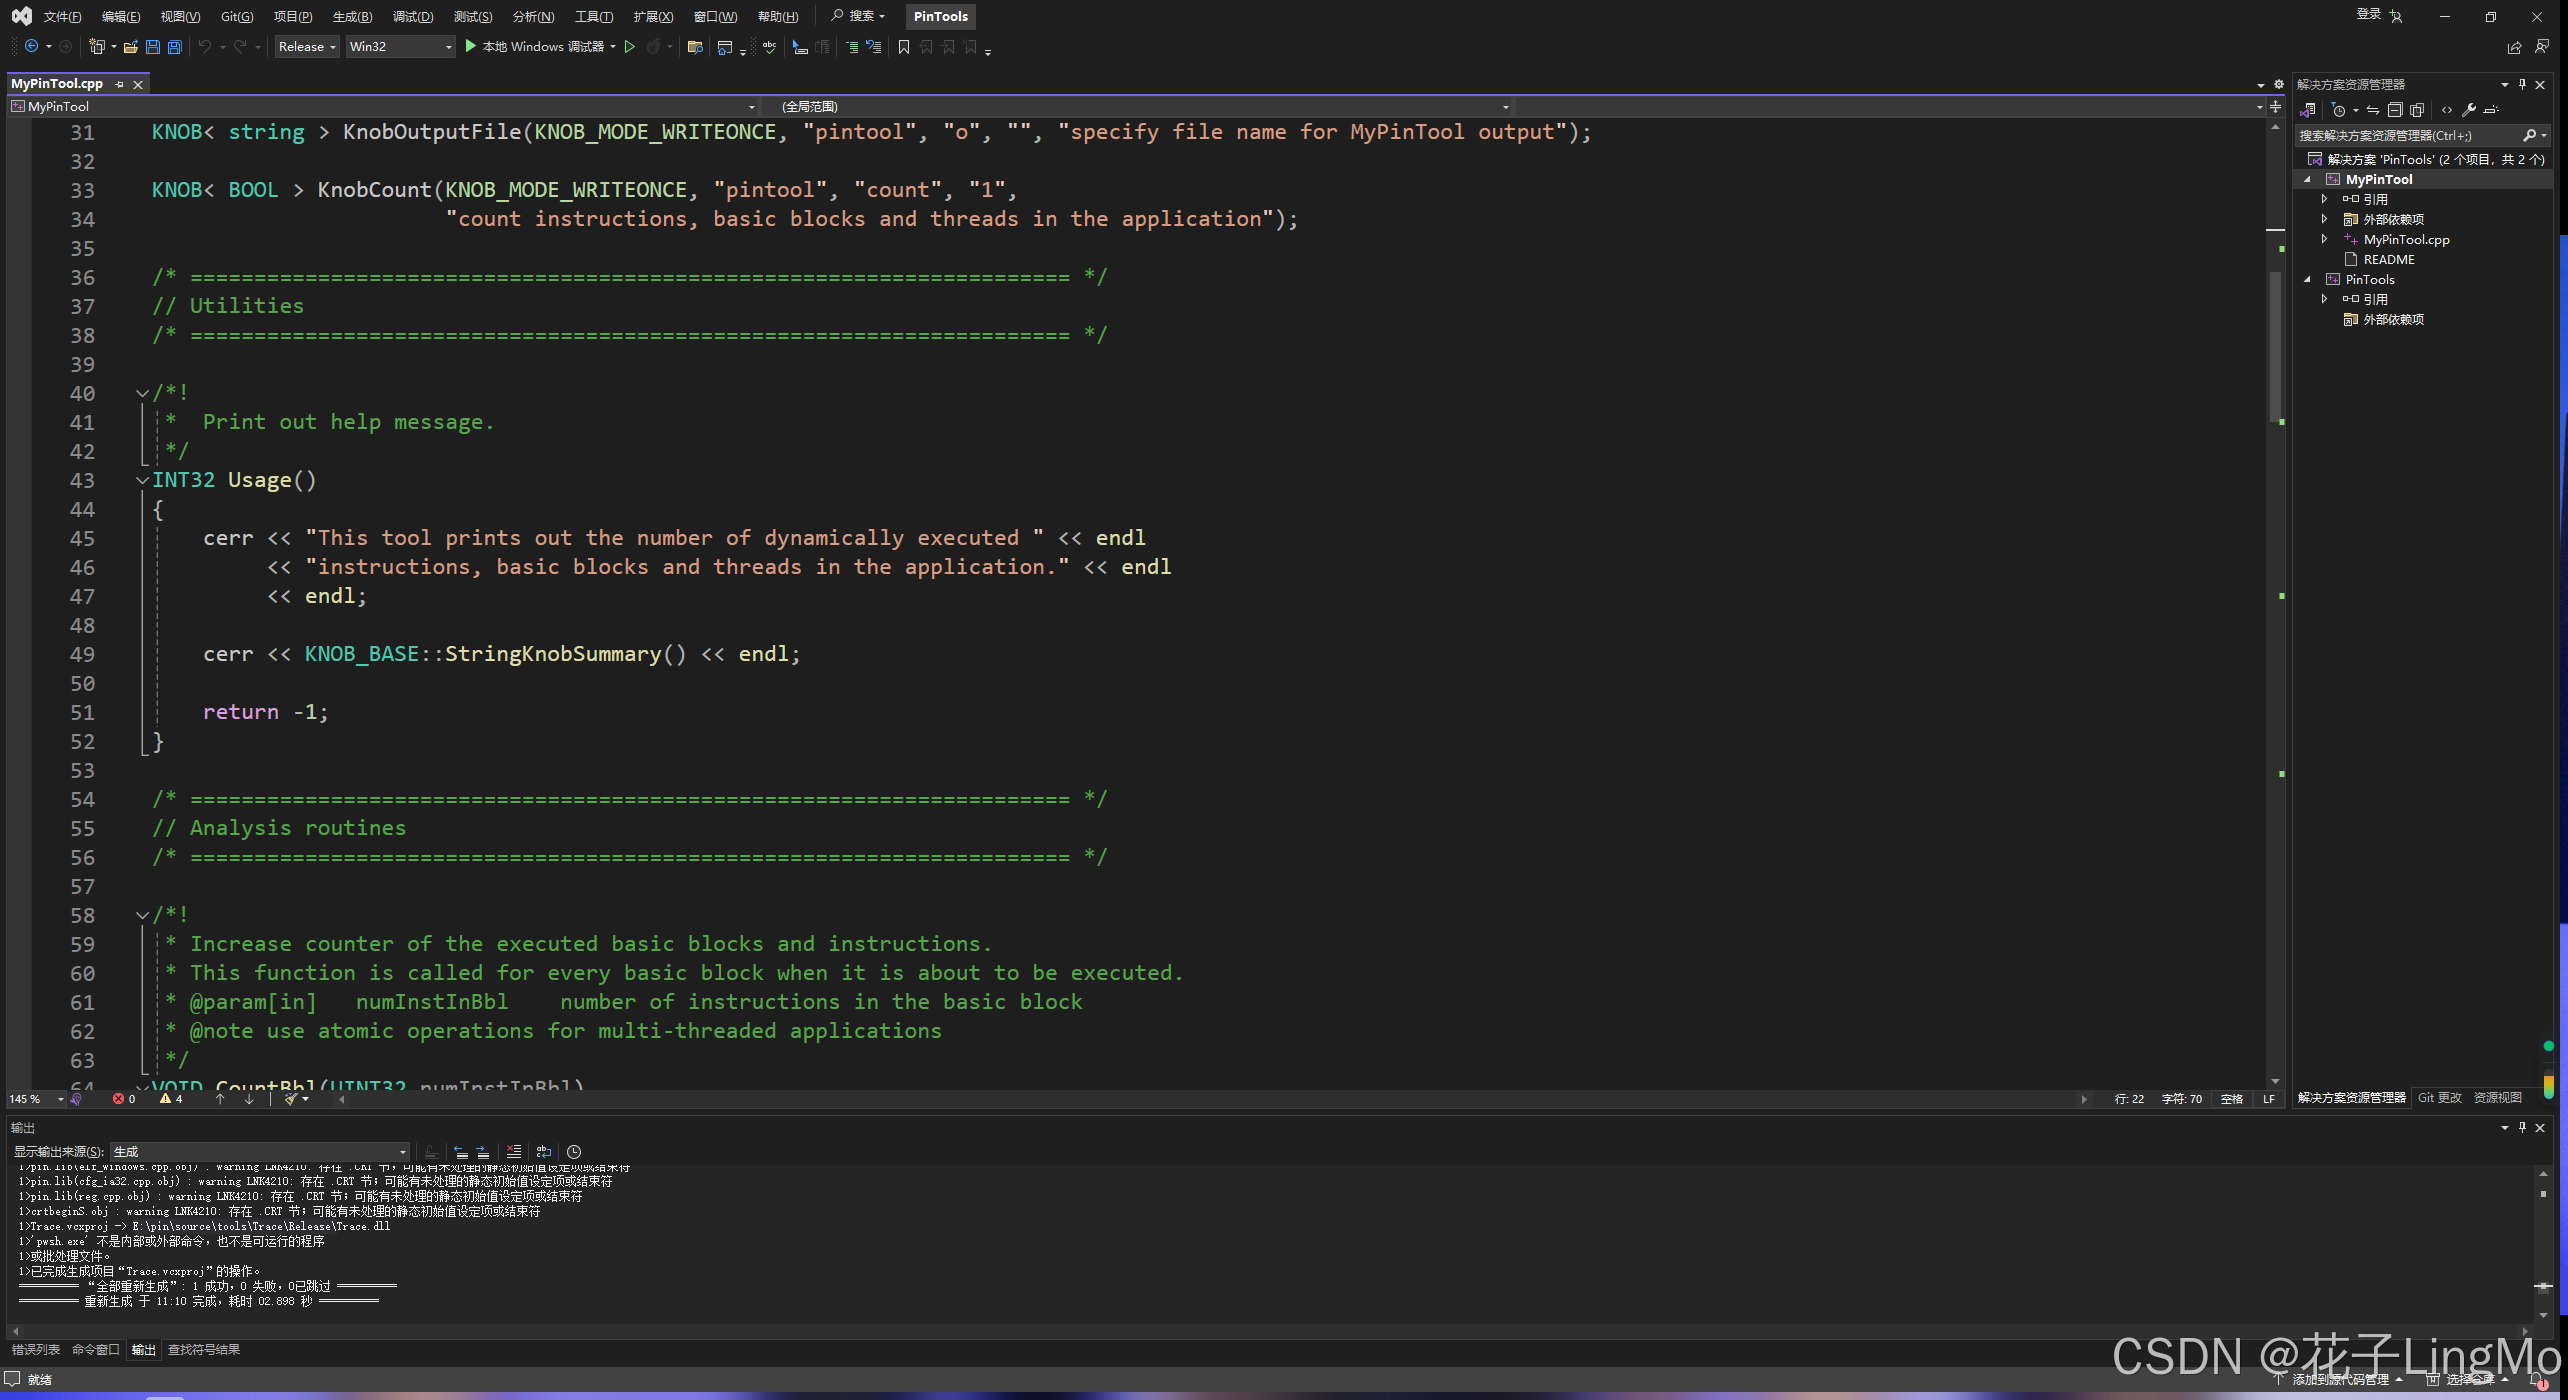
随后就能编译了
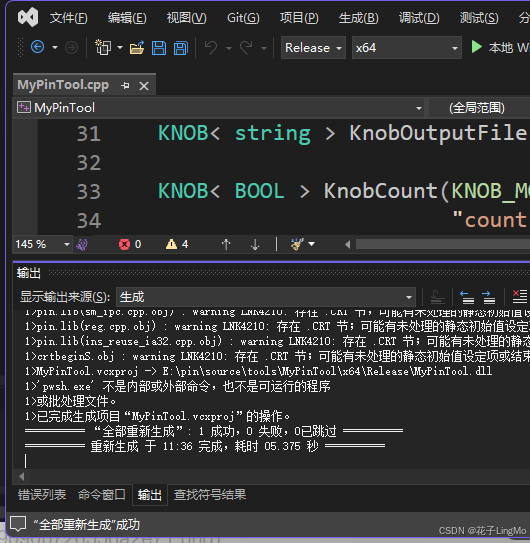
3. 测试
现在我们拿32位程序作测试,我们随便创建个目录,把要测试的程序和你的pintool的dll文件都放进去(这里就假定你把pin.exe的路径弄到环境变量里边来了)
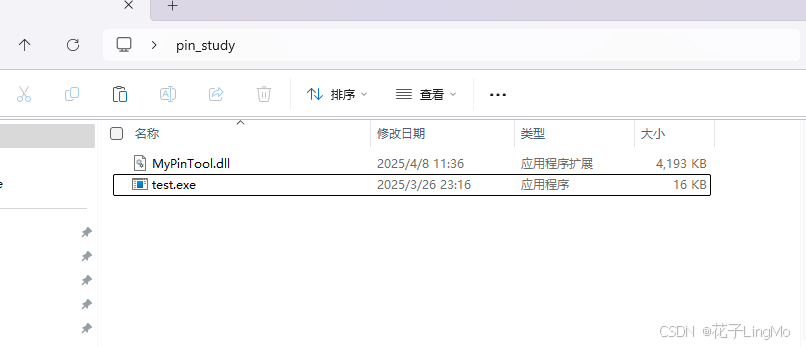
然后我们在此处打开cmd,输入以下命令
pin -t MyPinTool.dll -- test.exe
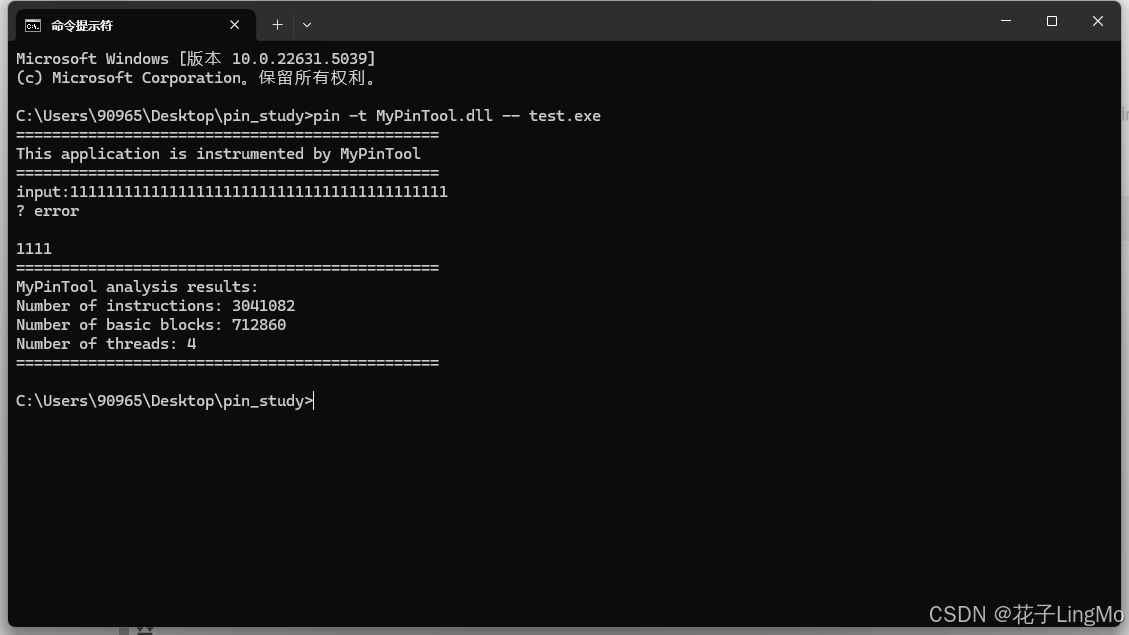
好的,现在看来我们安装Intel-Pin的过程都完美成功了
4. 其他说明
C:\Users\90965\Desktop\pin_study>pin -h
Pin: pin-3.31-98869-fa6f126a8
版权所有 © 2002-2024 英特尔公司。

用法:pin [选项] [-t <工具> [<工具参数>]] -- <命令行>
使用 -help 查看选项的详细说明。

通用开关:

-assert_check_inline  [默认 0]
  当被标记为 IARG_CHECK_INLINE 的分析函数无法内联时触发断言。

-debug_instrumented_processes  [默认 0]
  打印消息,以便调试器可以附加到已插桩的进程。

-detach_reattach  [默认 0]
  在探测模式中允许分离和重新附加。

-error_file  [默认 空]
  错误日志文件名。

-follow_execv  [默认 0]
  对通过 execv 类系统调用生成的所有进程都使用 Pin 执行。

-inline  [默认 1]
  内联简单的分析函数。

-log_inline  [默认 0]
  打印分析函数是否已被内联。

-logfile  [默认 pin.log]
  日志文件路径和名称。

-move_then_to_stub  [默认 1]
  将 IF-THEN 插桩结构中的 THEN 部分移动到 stub 区域。

-mt  [默认 1]
  允许多线程程序。

-p32  [默认 空]
  指定适用于 IA-32 架构的 Pin 可执行文件。

-p64  [默认 空]
  指定适用于 Intel® 64 架构的 Pin 可执行文件。

-pause_tool  [默认 0]
  在加载工具之前暂停 Pin 指定的秒数,以便调试器可以附加到 Pin 所插桩的进程。Pin 会在标准输出和日志中打印详细的调试器连接说明,包括添加调试信息的命令。此选项主要供 Pin 开发者调试使用。
  特殊值:1 - 打印信息但不暂停。

-pid  [默认 0]
  附加到指定 PID 的进程。

-probe  [默认 0]
  表示工具使用 Pin Probes。

-smc_strict  [默认 0]
  检测基本块内的自修改代码。

-smc_support  [默认 1]
  支持自修改代码(SMC)。

-t64  [默认 空]
  指定适用于 Intel® 64 架构的工具二进制文件。

-tool_load_option
  加载工具时的附加选项。

-unique_error_file  [默认 0]
  错误日志文件名中将包含进程ID。

-unique_logfile  [默认 0]
  日志文件名中将包含进程ID。

-version  [默认 0]
  打印版本信息。

通用开关(在 pin 和工具中都可用):

-h  [默认 0]
  打印帮助信息(等同于 -help)。

-help  [默认 0]
  打印帮助信息。

-ifeellucky  [默认 0]
  跳过不支持平台的警告信息,并将某些错误转化为警告。

-slow_asserts  [默认 0]
  执行耗时的健全性检查。

调试应用程序的开关:

-appdebug  [默认 0]
  调试应用程序,在程序启动时立刻在调试器中暂停。

-appdebug_allow_remote  [默认 0]
  在启用应用程序调试时,默认要求调试器与 Pin 在同一系统上运行。此选项允许连接运行在远程系统上的调试器。
  注意:如果指定了 -appdebug_connection,则忽略此选项,因为后者已明确指定调试器运行的机器。

-appdebug_connection  [默认 空]
  在启用应用程序调试时,Pin 默认打开一个 TCP 端口并等待调试器连接。此选项可反转角色:调试器打开一个 TCP 端口并等待 Pin 连接,地址格式为 “[ip]:端口”。
  如果指定了 ip,则应使用点分十进制表示;若省略 ip,则表示连接到本机的指定端口。端口号为十进制。
  注意:使用 GDB 调试时不会使用该选项。

-appdebug_enable  [默认 0]
  启用应用程序级调试器支持,但不在应用启动时暂停。可在启动后连接调试器。

-appdebug_exclude
  在启用应用程序调试并启用 -follow_execv 时,默认对所有子进程启用调试。此可重复使用的选项指定禁用调试的应用程序名称,如果 argv[0] 匹配某个名称,则该子进程不启用调试。

-appdebug_server_port  [默认 0]
  在启用应用程序调试时,Pin 默认绑定到系统分配的随机 TCP 端口并等待调试器连接。此选项可指定特定端口供调试器连接。

-appdebug_silent  [默认 0]
  在启用调试时,Pin 通常会打印一条提示如何连接调试器的信息。此选项关闭该提示信息。如果指定了 -appdebug_connection,则不会打印该信息。

代码缓存相关开关:

-cache_block_size  [默认 262144]
  代码缓存分配单元的大小(以字节为单位)。为获得最佳效果,请设为页面大小的整数倍。

-cc_memory_size  [默认 0]
  最大代码缓存大小(单位字节,0表示默认)。必须是缓存块大小的整数倍。

-cc_memory_size_64  [默认 0]
  64位系统上的最大代码缓存大小(单位字节,0表示默认)。必须是缓存块大小的整数倍。

限制内存使用的参数:

-pin_memory_range
  为 Pin 和工具的动态内存分配指定虚拟内存地址范围。例如:
  0x80000000:0x90000000。此选项可以重复使用以指定多个范围。

-pin_memory_size  [默认 0]
  Pin 和工具可动态分配的最大字节数(0 = 不限制,建议至少分配30MB)。


 3817
3817

 被折叠的 条评论
为什么被折叠?
被折叠的 条评论
为什么被折叠?
 到【灌水乐园】发言


