


前言
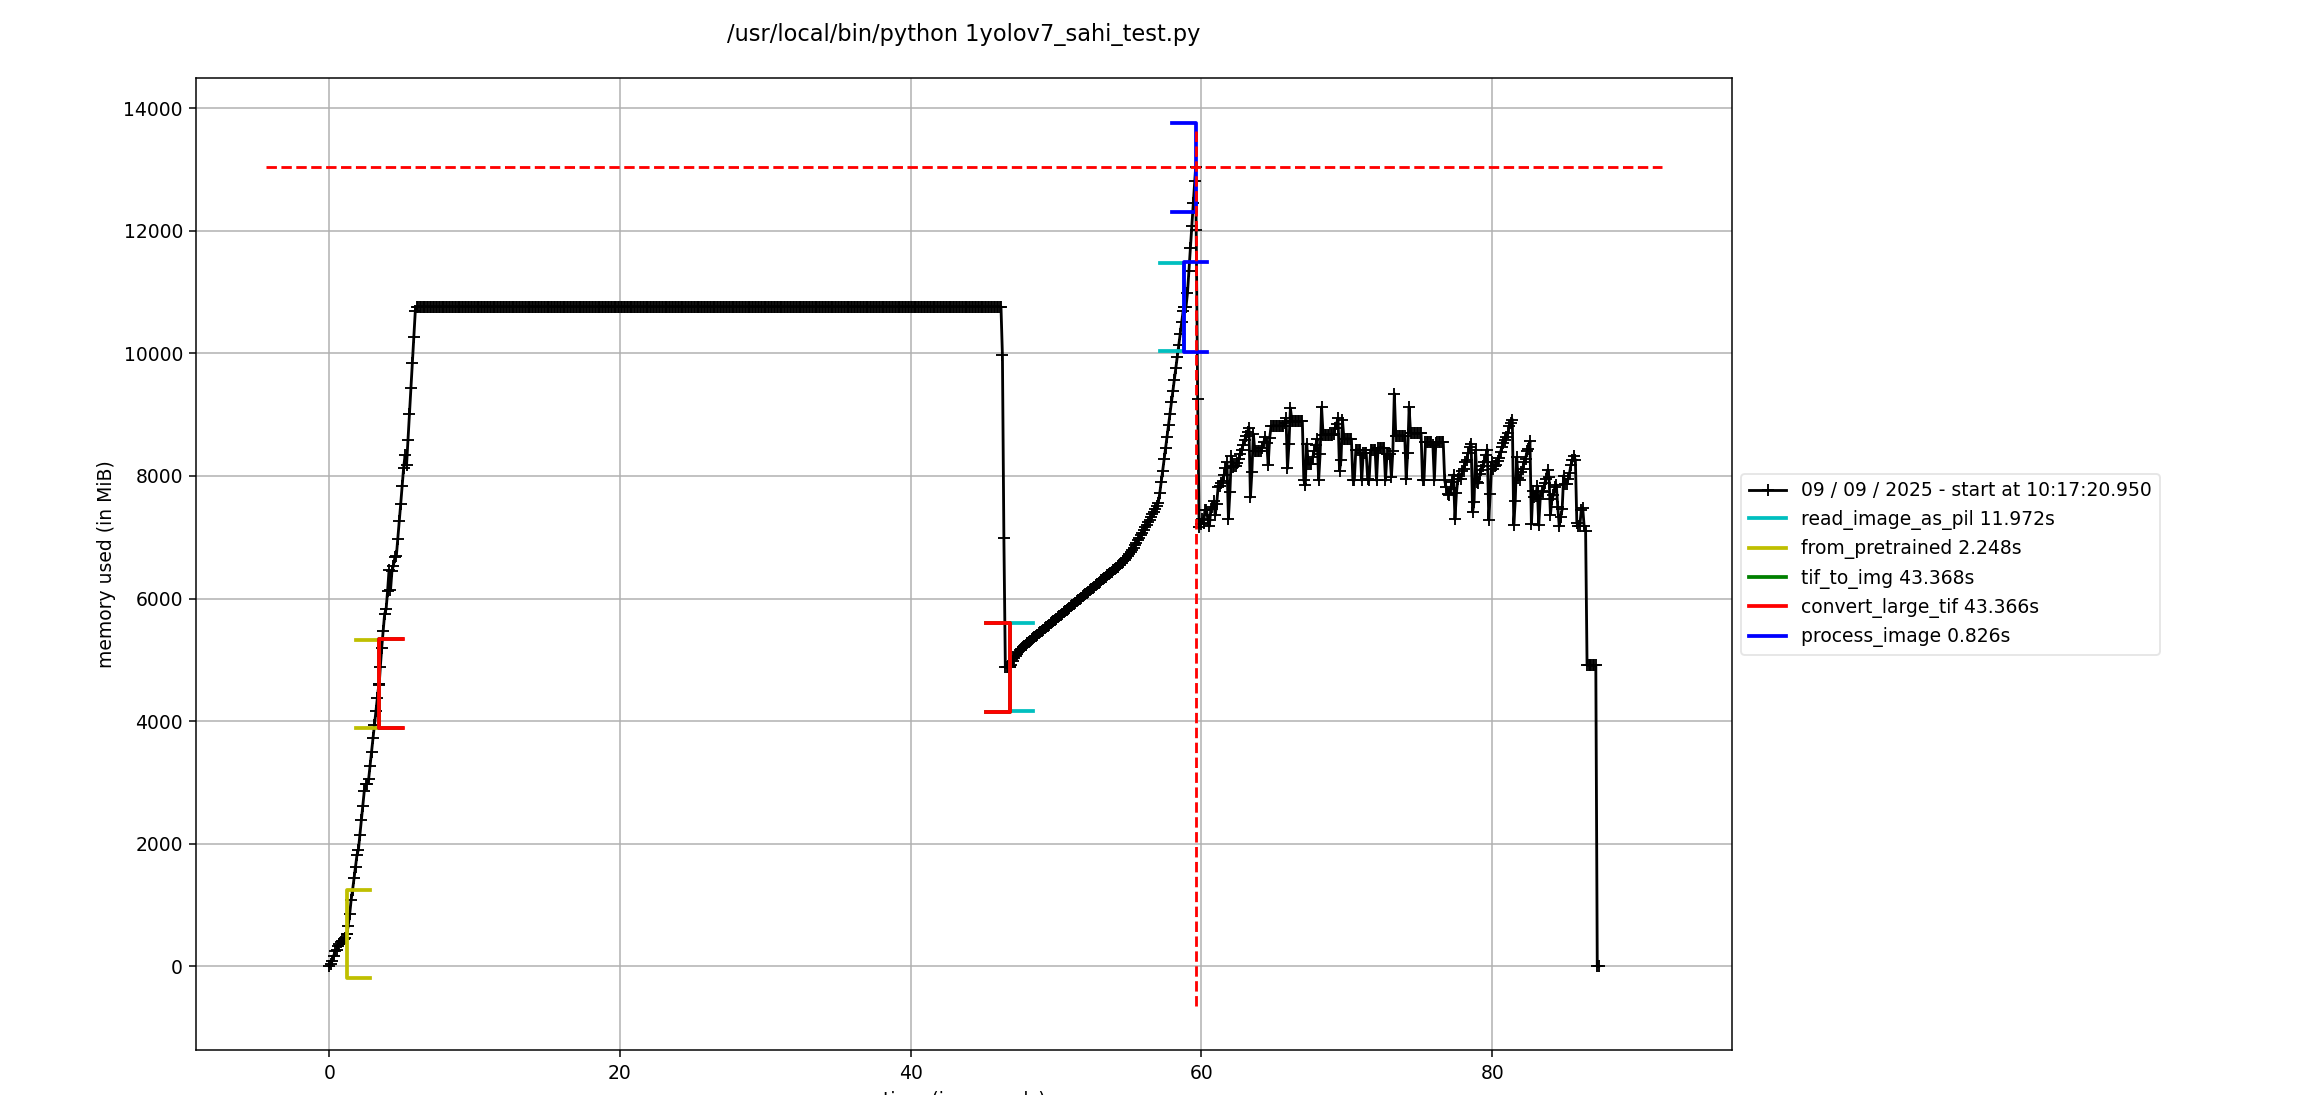
最近项目中遇到python程序调用异常的问题,读1G大小的tif文件转png图,再进行推理,峰值内存能达到12.8G,不合常理。需要排查下内存占用异常,这就接触到了memory_profiler库,借此机会记录下。
一、memory_profiler
memory_profiler是一个用于监控 Python 程序内存使用情况的工具,可以逐行分析代码的内存消耗。
1.安装
pip install memory_profiler
pip install matplotlib  #配合使用画图功能
2.用法
2.1使用装饰器分析函数
from memory_profiler import profile

@profile
def memory_intensive_task():
    # 创建一个大型列表
    big_list = [0] * 10**6  # 约 8 MB

    # 创建更大的字典
    big_dict = {i: str(i) for i in range(10**5)}  # 约 10 MB

    # 创建大型字符串
    big_string = " " * 10**7  # 约 10 MB

    # 释放部分内存
    del big_dict

    return big_list, big_string

if __name__ == "__main__":
    memory_intensive_task()
运行脚本:python your_script.py
输出示例:
Line #    Mem usage    Increment  Occurrences   Line Contents
============================================================
     4     20.5 MiB     20.5 MiB           1   @profile
     5                                         def memory_intensive_task():
     6     28.4 MiB      7.9 MiB           1       big_list = [0] * 10**6
     7     38.5 MiB     10.1 MiB           1       big_dict = {i: str(i) for i in range(10**5)}
     8     48.6 MiB     10.1 MiB           1       big_string = " " * 10**7
     9     38.5 MiB    -10.1 MiB           1       del big_dict
    10     38.5 MiB      0.0 MiB           1       return big_list, big_string
其中,@profile可选参数如下:
跟踪子进程内存
@profile(include_children=True)
将报告输出到文件
@profile(stream=open('memory_report.log', 'w+'))
输出到标准错误
@profile(stream=sys.stderr)
2.2使用命令行工具 mprof
# 运行程序并记录内存使用
mprof run your_script.py #会生成.bat文件

# 生成内存使用图表
mprof plot

# 查看统计摘要
mprof stats
若是再windows系统下,查看图表可以执行如下命令:
python d:\anaconda3\envs\***\lib\site-packages\mprof.py plot mprofile_20250908161012.dat
需要根据自己的环境做对应的配置修改,能得到类似的内存耗时情况图
2.3实时监控内存使用
from memory_profiler import memory_usage
import time

def memory_monitored_task():
    results = []
    for i in range(5):
        # 每次迭代分配更多内存
        results.append([0] * i * 10**6)
        time.sleep(0.5)
    return results

if __name__ == "__main__":
    # 每 0.1 秒采样一次内存使用
    mem_usage = memory_usage((memory_monitored_task, (), {}), interval=0.1)
    print(f"最大内存使用: {max(mem_usage):.2f} MiB")
    print(f"内存使用记录: {mem_usage}")
其中memory_usage选的参数如下:
mem_usage = memory_usage(
    (func, args, kwargs),  # 函数和参数,args: 位置参数列表,kwargs: 关键字参数字典
    interval=0.1,          # 采样间隔(秒)
    max_usage=True,        # 只返回峰值内存
    include_children=True, # 包含子进程内存
    retval=True            # 返回函数结果
)
小结
通过合理使用 memory_profiler,可以有效识别内存瓶颈,找出高内存占用代码块,从而优化程序内存使用效率。
如果阅读本文对你有用,欢迎一键三连呀!!!
2025年9月9日19:04:06


 1299
1299

 被折叠的 条评论
为什么被折叠?
被折叠的 条评论
为什么被折叠?
 到【灌水乐园】发言


