


ndarray的运算
1 逻辑运算
# 重新生成8只股票10个交易日的涨跌幅数据
>>> stock_change = np.random.normal(0, 1, (8, 10))
>>> stock_change = stock_change[0:5, 0:5]
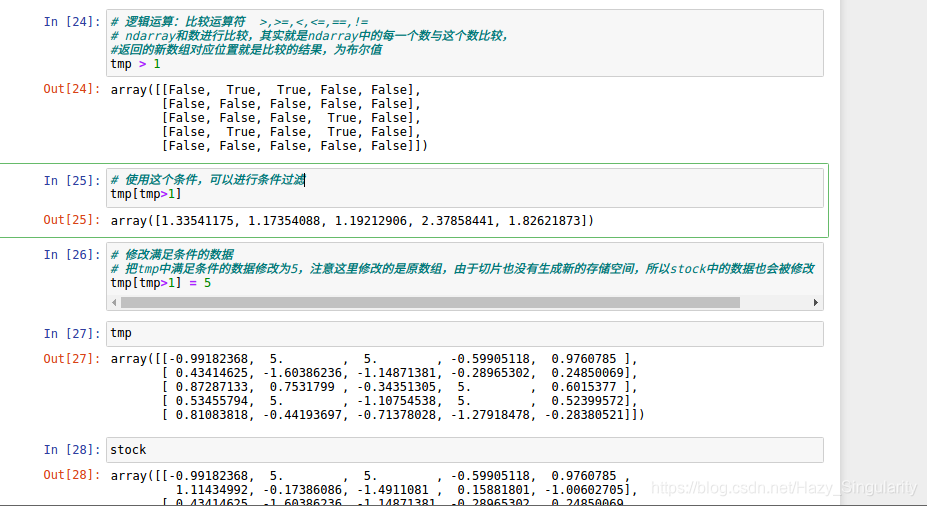
# 逻辑判断, 如果涨跌幅大于0.5就标记为True 否则为False
>>> stock_change > 0.5
array([[ True, False, False, True, False],
[ True, True, False, False, False],
[ True, False, True, False, True],
[False, True, False, False, False],
[False, False, False, True, True]])
# BOOL赋值, 将满足条件的设置为指定的值-布尔索引
>>> stock_change[stock_change > 0.5] = 1
array([[ 1. , -0.72404879, -1.33045773, 1. , 0.3869043 ],
[ 1. , 1. , 0.20815446, -1.67860823, 0.06612823],
[ 1. , 0.42753488, 1. , -0.24375089, 1. ],
[-0.971945 , 1. , -0.95444661, -0.2602084 , -0.48736497],
[-0.32183056, -0.92544956, -0.42126604, 1. , 1. ]])
# ndarray和数进行比较,其实就是ndarray中的每一个数与这个数比较,返回的新数组对应位置就是比较的结果,为布尔值
2 通用判断函数
np.all()
# 判断stock_change[0:2, 0:5]是否全是上涨的
>>> np.all(stock_change[0:2, 0:5] > 0)
False
np.any()
# 判断前5只股票这段期间是否有上涨的
>>> np.any(stock_change[0:5, :] > 0 )
True
3 np.where(三元运算符)
通过使用np.where能够进行更加复杂的运算
np.where()
# 判断前四个股票前四天的涨跌幅 大于0的置为1,否则为0
temp = stock_change[:4, :4]
np.where(temp > 0, 1, 0)
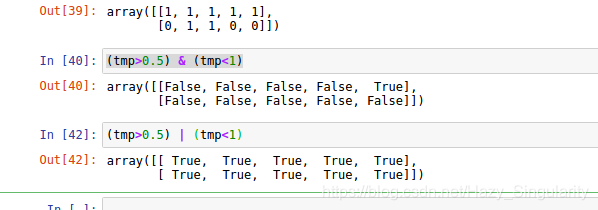
复合逻辑需要结合np.logical_and和np.logical_or使用
# 判断前四个股票前四天的涨跌幅 大于0.5并且小于1的,换为1,否则为0
# 判断前四个股票前四天的涨跌幅 大于0.5或者小于-0.5的,换为1,否则为0
np.where(np.logical_and(temp > 0.5, temp < 1), 1, 0)
np.where(np.logical_or(temp > 0.5, temp < -0.5), 1, 0)
逻辑与或也可以这么写
4 统计运算
如果想要知道涨幅或者跌幅最大的数据,应该怎么做?
4.1 统计指标
在数据挖掘/机器学习领域,统计指标的值也是我们分析问题的一种方式。常用的指标如下:
axis=0表示按列统计,axis=1表示按行统计
min(a[, axis, out, keepdims])
Return the minimum of an array or minimum along an axis.
返回数组的最小值或沿着某个坐标轴统计的最小值数组

max(a[, axis, out, keepdims])
Return the maximum of an array or maximum along an axis.
返回数组的最大值或沿着某个坐标轴统计的最大值数组

median(a[, axis, out, overwrite_input, keepdims])
Compute the median along the specified axis.
计算指定坐标轴的中位数
计算中位数之前会先对数据排序,中位数为排序后中间那个数或者中间两个数的平均值

mean(a[, axis, dtype, out, keepdims])
Compute the arithmetic mean along the specified axis.
计算指定坐标轴的平均数

std(a[, axis, dtype, out, ddof, keepdims])
Compute the standard deviation along the specified axis.
计算指定坐标轴的标准差

var(a[, axis, dtype, out, ddof, keepdims])
Compute the variance along the specified axis.
计算指定坐标轴的方差
例:
# 按行或列统计最大值
np.max(stock,axis=0)
获取最大值和最小值的索引,返回目标值的下标
np.argmax(temp, axis=)
np.argmin(temp, axis=)
4.2 案例:股票涨跌幅统计运算
进行统计的时候,axis 轴的取值并不一定,Numpy中不同的API轴的值都不一样,在这里,axis 0代表列, axis 1代表行去进行统计
# 接下来对于这4只股票的4天数据,进行一些统计运算
# 指定行 去统计
print("前四只股票前四天的最大涨幅{}".format(np.max(temp, axis=1)))
# 使用min, std, mean
print("前四只股票前四天的最大跌幅{}".format(np.min(temp, axis=1)))
print("前四只股票前四天的波动程度{}".format(np.std(temp, axis=1)))
print("前四只股票前四天的平均涨跌幅{}".format(np.mean(temp, axis=1)))
如果需要统计出哪一只股票在某个交易日的涨幅最大或者最小?

np.argmax(temp, axis=)
np.argmin(temp, axis=)
# 获取股票指定哪一天的涨幅最大
print("前四只股票前四天内涨幅最大{}".format(np.argmax(temp, axis=1)))
print("前四天一天内涨幅最大的股票{}".format(np.argmax(temp, axis=0)))
矩阵和数组的区别
矩阵,英文matrix,和array的区别矩阵必须是2维的,但是array可以是多维的。
1 数组与数的运算
arr = np.array([[1, 2, 3, 2, 1, 4], [5, 6, 1, 2, 3, 1]])
arr + 1
arr / 2

# 可以对比python列表的运算,看出区别
a = [1, 2, 3, 4, 5]
a * 3
3 数组与数组的运算
arr1 = np.array([[1, 2, 3, 2, 1, 4], [5, 6, 1, 2, 3, 1]])
arr2 = np.array([[1, 2, 3, 4], [3, 4, 5, 6]])
上面这个能进行运算吗,结果是不行的!
4 广播机制
执行 broadcast 的前提在于,两个 ndarray 执行的是 element-wise的运算,Broadcast机制的功能是为了方便不同形状的ndarray(numpy库的核心数据结构)进行数学运算。
当操作两个数组时,numpy会逐个比较它们的shape(构成的元组tuple),只有在下述情况下,两个数组才能够进行数组与数组的运算。
1.维度相等
2.shape(其中相对应的一个地方为1)
以上情况满足其一即可
简单来说就是
1.要么对应维度元素数量全相等
2.要么对应维度二者之间有一个维度元素数量为1
才能满足广播机制,才能进行运算。
例如:
(数字均指在那一维度元素数量,即形状,从左到右为高维到低维)
Image (3d array): 256 x 256 x 3
Scale (1d array): 3
Result (3d array): 256 x 256 x 3
A (4d array): 9 x 1 x 7 x 1
B (3d array): 8 x 1 x 5
Result (4d array): 9 x 8 x 7 x 5
A (2d array): 5 x 4
B (1d array): 1
Result (2d array): 5 x 4
A (3d array): 15 x 3 x 5
B (3d array): 15 x 1 x 1
Result (3d array): 15 x 3 x 5
如果是下面这样,则不匹配:
A (1d array): 10
B (1d array): 12
A (2d array): 2 x 1
B (3d array): 8 x 4 x 3
思考:下面两个ndarray是否能够进行运算?
arr1 = np.array([[1, 2, 3, 2, 1, 4], [5, 6, 1, 2, 3, 1]])
arr2 = np.array([[1], [3]])
5 矩阵运算
5.1 矩阵乘法api:
np.matmul
np.dot
a = np.array([[80, 86],
[82, 80],
[85, 78],
[90, 90],
[86, 82],
[82, 90],
[78, 80],
[92, 94]])b = np.array([[0.7], [0.3]])
np.matmul(a, b)
array([[81.8],
[81.4],
[82.9],
[90. ],
[84.8],
[84.4],
[78.6],
[92.6]])np.dot(a,b)
array([[81.8],
[81.4],
[82.9],
[90. ],
[84.8],
[84.4],
[78.6],
[92.6]])
np.matmul和np.dot的区别:
二者都是矩阵乘法。 np.matmul中禁止矩阵与标量的乘法。 在矢量乘矢量的內积运算中,np.matmul与np.dot没有区别。
matmul 只能用于矢量和矢量之间的矩阵乘法,dot 可以用于矢量和标量(常数)之间的矩阵乘法


 被折叠的 条评论
为什么被折叠?
被折叠的 条评论
为什么被折叠?
 到【灌水乐园】发言


