


小序
于时光的长河中,我似一叶扁舟,悠悠然漂泊。四周是无垠的平静,波澜不惊,仿佛世间喧嚣皆被隔绝于这方天地之外。晨曦微露,阳光轻柔地洒在身上,暖意却不浓烈,恰似心底这份淡然。没有狂风骤雨的洗礼,亦无繁花似锦的绚烂,只有这如水的宁静,静静流淌于心间。此刻,心似澄澈湖面,倒映着天光云影,任岁月轻柔地拂过,不惊不扰,于平淡中,品出生活的本真韵味。
承接上文,这篇文章我们来谈一下 vue-charts 的使用,顺便谈下笔者在使用 过程中遇到的问题,供大家参考。
vue-charts
vue-charts 提供了Vue.js组件来创建图表,简化了渲染图表的过程。vue-echarts库支持多种图表类型,包括复杂的可视化如蜡烛图、热图和树图等。它还提供了深度定制能力,允许开发者操纵图表的几乎每个方面,使用户能够创建满足特定设计和功能需求的定制化可视化。
此外,vue-echarts适用于处理大型数据集,并且具有高性能,它的虚拟滚动和懒加载功能使其成为处理复杂数据可视化应用的优秀选择
我们直接来看代码
<template>
<div class="chart-container">
<v-chart ref="chartRef" :options="chartOptions" />
</div>
</template>
<script>
import { ref, onMounted } from 'vue';
import * as echarts from 'echarts/core';
import { CanvasRenderer } from 'echarts/renderers';
import { LineChart } from 'echarts/charts';
import {
TitleComponent,
TooltipComponent,
LegendComponent,
GridComponent,
DataZoomComponent
} from 'echarts/components';
import VChart from 'vue-echarts';
// 注册必要的组件
echarts.use([
CanvasRenderer,
LineChart,
TitleComponent,
TooltipComponent,
LegendComponent,
GridComponent,
DataZoomComponent
]);
export default {
components: { VChart },
setup() {
const chartRef = ref(null);
// 图表配置
const chartOptions = ref({
title: {
text: '用户满意度评分趋势',
left: 'center',
textStyle: {
fontSize: 18,
fontWeight: 'bold',
color: '#333'
}
},
tooltip: {
trigger: 'axis',
axisPointer: {
type: 'line',
lineStyle: {
color: '#ccc'
}
}
},
legend: {
data: ['评分'],
right: '10%'
},
xAxis: {
type: 'category',
boundaryGap: false,
data: ['产品A', '产品B', '产品C', '产品D', '产品E', '产品F'],
axisLine: {
lineStyle: {
color: '#666'
}
},
axisLabel: {
textStyle: {
color: '#666'
}
}
},
yAxis: {
type: 'value',
min: 0,
max: 10,
interval: 2,
name: '评分(满分10分)',
axisLine: {
lineStyle: {
color: '#666'
}
},
axisLabel: {
textStyle: {
color: '#666'
}
}
},
series: [
{
name: '评分',
type: 'line',
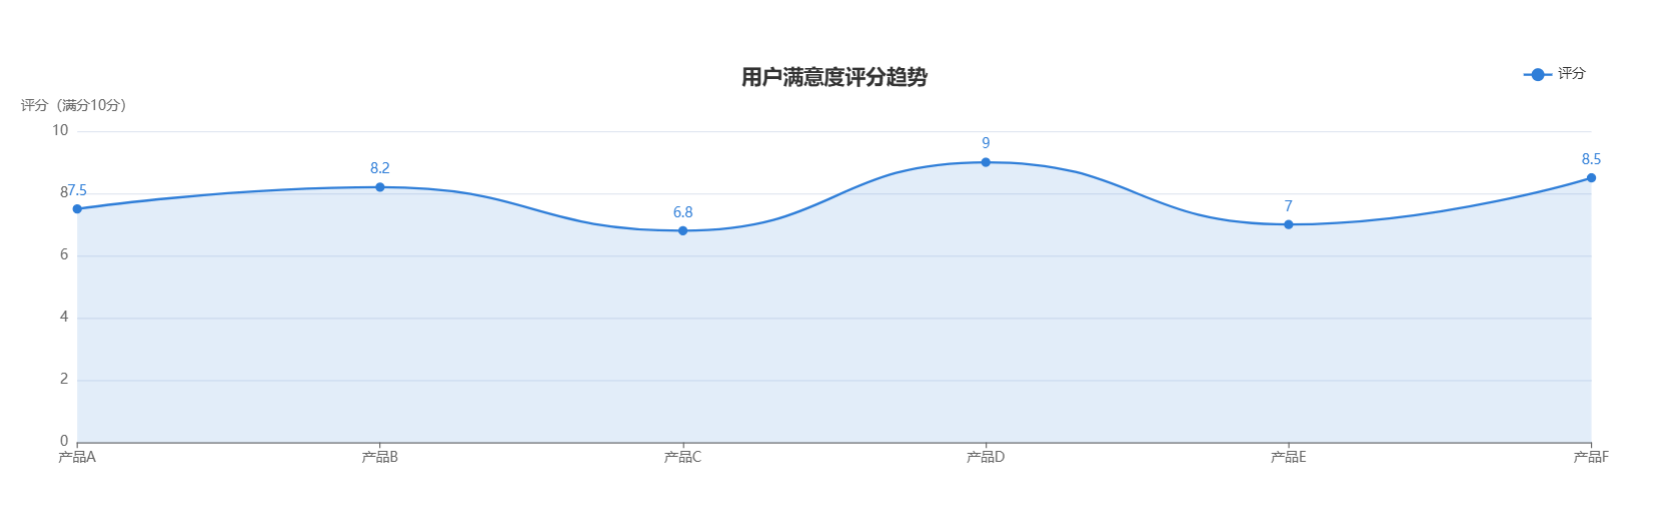
data: [7.5, 8.2, 6.8, 9.0, 7.0, 8.5],
symbol: 'circle',
symbolSize: 8,
lineStyle: {
color: '#2f7ed8',
width: 2
},
itemStyle: {
color: '#2f7ed8'
},
areaStyle: {
color: 'rgba(47, 126, 216, 0.2)'
},
label: {
show: true,
position: 'top',
formatter: '{c}',
textStyle: {
color: '#2f7ed8',
fontSize: 12
}
},
smooth: true, // 平滑曲线
animationDuration: 1000, // 动画时长
animationEasing: 'elasticOut' // 动画效果
}
]
});
// 响应式调整
onMounted(() => {
window.addEventListener('resize', () => {
if (chartRef.value) {
chartRef.value.resize();
}
});
});
return {
chartRef,
chartOptions
};
}
};
</script>
<style scoped>
.chart-container {
width: 100%;
height: 400px;
}
</style>
有的读者觉得,这和之前调用 echart API 没什么区别呀,但是实则不然,这里简单说明下,不再深度赘述了。感兴趣的读者欢迎在评论区留言,笔者看到会及时回复。
其相较api 调用来说
集成简化:vue-echarts 将 ECharts 封装为 Vue 组件,使得在 Vue 应用中集成图表变得简单直接,无需手动操作 DOM。
响应式更新:vue-echarts 组件能够响应 Vue 的响应式系统,当数据变化时图表会自动更新,无需手动调用 ECharts 的 setOption 方法。
生命周期钩子:vue-echarts 组件遵循 Vue 的生命周期钩子,可以在组件的 mounted、beforeDestroy 等生命周期钩子中进行图表的初始化和销毁操作。
还涉及到性能的优化和组件化的复用,可提高开发效率,增强体验感
肯实践的读者此时可能发现了,为什么我的代码按如上copy 但是却没显现图表呢
如下图 空空如也…

仔细看,这是有东西的,没错!白屏!!!
这是因为,图表没有被正确初始化
虽然已经正确地设置了图表的配置(chartOptions),但是没有在组件挂载后立即应用这些配置
我们加入一些调试代码试下,同时,我加入正确的代码看看大家能不能看出来是哪块起了作用
<template>
  <div class="chart-container">
    <v-chart ref="chartRef" autoresize />
  </div>
  <p>hello world</p>
</template>

<script>
import { ref, onMounted, nextTick } from 'vue';
import * as echarts from 'echarts/core';
import { CanvasRenderer } from 'echarts/renderers';
import { LineChart } from 'echarts/charts';
import {
  TitleComponent,
  TooltipComponent,
  LegendComponent,
  GridComponent,
  DataZoomComponent
} from 'echarts/components';
import VChart from 'vue-echarts';

// 注册必要的组件
echarts.use([
  CanvasRenderer,
  LineChart,
  TitleComponent,
  TooltipComponent,
  LegendComponent,
  GridComponent,
  DataZoomComponent
]);

export default {
  components: { VChart },
  setup() {
    const chartRef = ref(null);

    // 图表配置
    const chartOptions = ref({
      title: {
        text: '用户满意度评分趋势',
        left: 'center',
        textStyle: {
          fontSize: 18,
          fontWeight: 'bold',
          color: '#333'
        }
      },
      tooltip: {
        trigger: 'axis',
        axisPointer: {
          type: 'line',
          lineStyle: {
            color: '#ccc'
          }
        }
      },
      legend: {
        data: ['评分'],
        right: '10%'
      },
      xAxis: {
        type: 'category',
        boundaryGap: false,
        data: ['产品A', '产品B', '产品C', '产品D', '产品E', '产品F'],
        axisLine: {
          lineStyle: {
            color: '#666'
          }
        },
        axisLabel: {
          textStyle: {
            color: '#666'
          }
        }
      },
      yAxis: {
        type: 'value',
        min: 0,
        max: 10,
        interval: 2,
        name: '评分(满分10分)',
        axisLine: {
          lineStyle: {
            color: '#666'
          }
        },
        axisLabel: {
          textStyle: {
            color: '#666'
          }
        }
      },
      series: [
        {
          name: '评分',
          type: 'line',
          data: [7.5, 8.2, 6.8, 9.0, 7.0, 8.5],
          symbol: 'circle',
          symbolSize: 8,
          lineStyle: {
            color: '#2f7ed8',
            width: 2
          },
          itemStyle: {
            color: '#2f7ed8'
          },
          areaStyle: {
            color: 'rgba(47, 126, 216, 0.2)'
          },
          label: {
            show: true,
            position: 'top',
            formatter: '{c}',
            textStyle: {
              color: '#2f7ed8',
              fontSize: 12
            }
          },
          smooth: true, // 平滑曲线
          animationDuration: 1000, // 动画时长
          animationEasing: 'elasticOut' // 动画效果
        }
      ]
    });

    // 响应式调整
    onMounted(() => {
      console.log('Chart options:', chartOptions.value); // 确认 chartOptions 是否正确
      console.log('ECharts version:', echarts.version); // 确认 echarts 是否正确加载

      nextTick(() => {
        if (chartRef.value) {
          console.log('Chart instance:', chartRef.value); // 确认图表实例是否存在
          chartRef.value.setOption(chartOptions.value);
        }
      });

      window.addEventListener('resize', () => {
        if (chartRef.value) {
          console.log('Resizing chart...'); // 确认图表是否响应窗口大小变化
          chartRef.value.resize();
        }
      });
    });

    return {
      chartRef,
      chartOptions
    };
  }
};
</script>

<style scoped>
.chart-container {
  width: 100%;
  height: 400px;
}
</style>
我加入了版本的打印以及检查图表的实例与配置情况,也再次确认了窗口大小的影响
而实际上,没有显现图表的原因在上面已然说过了
注意 在 Vue 组件中使用 vue-echarts 时,通常需要在组件挂载后(onMounted 生命周期钩子)手动调用 setOption 方法来初始化图表。
在 nextTick 回调中,我添加了 chartRef.value.setOption(chartOptions.value); 这一行代码。这确保了在 Vue 的 next tick(即 DOM 更新完成后)立即应用图表配置
这也是为什么开始时未显示的原因
且通过监听窗口的 resize 事件,并在事件触发时调用 chartRef.value.resize();,确保图表能够响应窗口大小的变化
小结
通过这个案例,我们可以看到,解决 Vue 中 ECharts 图表不显示的问题,需要我们仔细检查图表的初始化过程、容器尺寸、CSS 样式以及响应式调整。希望本文的调试过程和解决方案能够帮助到遇到类似问题的开发者。
至此,关于echarts 的使用到这里就告一段落了,后面我会继续发布关于WEB开发的新内容,希望感兴趣的友友们及时关注,我们下次再见!
结束语
当夜幕低垂,星辰点缀,我将这份平淡的心情轻轻折叠,藏于心底最柔软的角落。它是我生命中的一抹素色,虽不浓烈,却足以抵御岁月的风霜。愿在这漫长的人生旅途中,无论风雨如何变幻,我都能带着这份平淡,继续前行,以一颗从容的心,迎接每一个清晨的曙光,送走每一个黄昏的余晖。
GOOD LUCK~


 2万+
2万+

 被折叠的 条评论
为什么被折叠?
被折叠的 条评论
为什么被折叠?
 到【灌水乐园】发言


