


1.Argoverse数据集
Argoverse数据集官方网址:https://www.argoverse.org/index.html
Argoverse在github的源码:https://github.com/argoverse/argoverse-api/tree/master
环境安装:博客1和博客2中有详细介绍
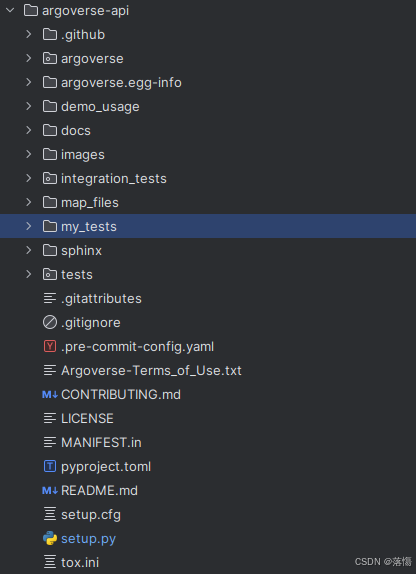
运行下述命令,可以得到完整的Argoverse源码,其中my_tests是我自己建立的文件夹:
git clone https://github.com/argoai/argoverse-api.git
安装好环境后,就可以开始实验了。
2.Argoverse轨迹预测介绍
本文只介绍使用demo,因此数据下载的是样例数据集。
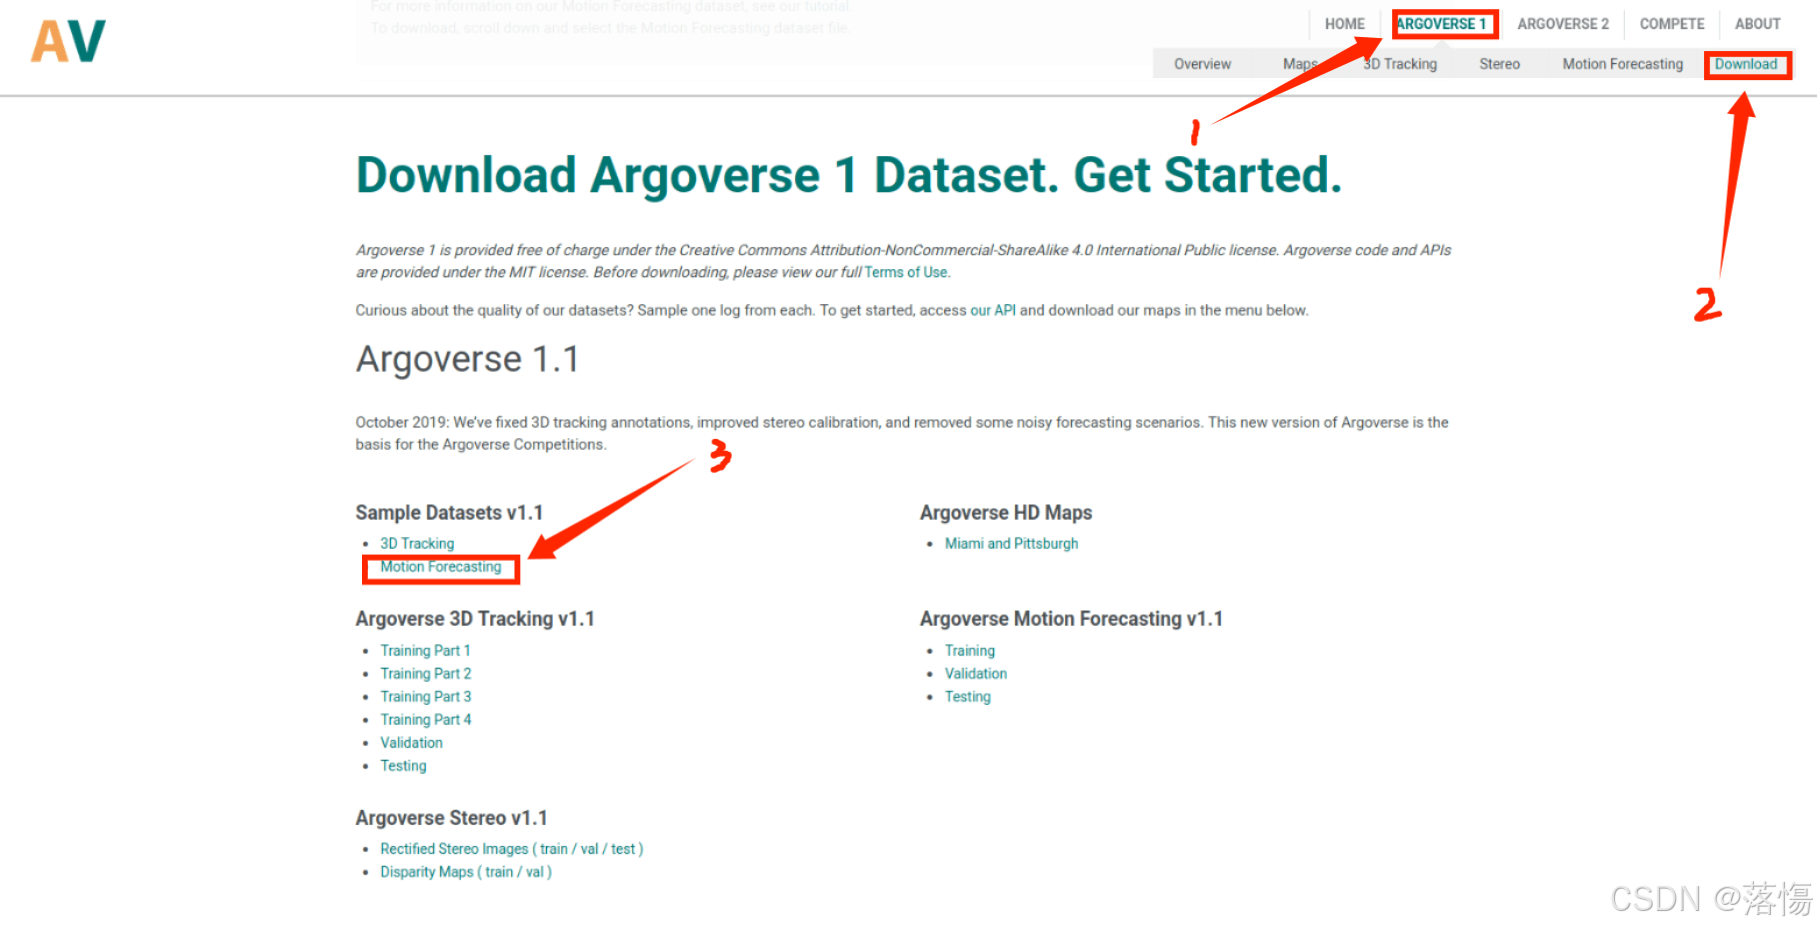 将数据放到自己建立的文件夹,样例的数据只有5个csv文件,在Argoverse Motion Forecasting v1.1中可以找到更多数据:

后面代码部分将在argoverse_forecasting_tutorial.py中编写。
csv文件打开后,部分数据展示:

2.1数据加载
from argoverse.data_loading.argoverse_forecasting_loader import ArgoverseForecastingLoader
##设置为自己存放数据的目录
root_dir = 'forecasting_sample/data/'
##
afl = ArgoverseForecastingLoader(root_dir)

print('Total number of sequences:',len(afl))
ArgoverseForecastingLoader是一个类,包含有以下的方法:
| 方法名 | 作用 | 返回类型 |
|---|---|---|
| __init__(self, root_dir) | 初始化方法,设置根目录和序列列表 | * |
| track_id_list(self) | 返回当前序列中的跟踪 ID 列表 | List[int] |
| city(self) | 返回当前序列的城市名称(‘PIT’ 或 ‘MIA’) | str |
| num_tracks(self) | 返回当前序列中的轨迹数量 | int |
| seq_df(self) | 返回当前序列的 Pandas DataFrame | pd.DataFrame |
| agent_traj(self) | 返回当前序列中 ‘AGENT’ 类型的轨迹(二维数组) | np.ndarray |
| __iter__(self) | 返回当前对象,以便可以进行迭代 | ArgoverseForecastingLoader |
| __next__(self) | 返回下一个序列的数据加载器对象 | ArgoverseForecastingLoader |
| __len__(self) | 返回数据中的序列数量 | int |
| __str__(self) | 返回当前序列的一些统计信息字符串 | str |
| __getitem __(self, key) | 返回给定索引的序列的数据加载器对象 | ArgoverseForecastingLoader |
| get(self, seq_id) | 返回给定序列路径的数据加载器对象 | ArgoverseForecastingLoader |
ArgoverseForecastingLoader类的部分方法使用如下:
from argoverse.data_loading.argoverse_forecasting_loader import ArgoverseForecastingLoader

##set root_dir to the correct path to your dataset folder
root_dir = 'forecasting_sample/data/'

afl = ArgoverseForecastingLoader(root_dir)

print('Total number of sequences:',len(afl))

for argoverse_forecasting_data in (afl):
    print(argoverse_forecasting_data)    #输出单个csv文件的简要信息(City和轨迹数量)
    print(argoverse_forecasting_data.track_id_list)   #输出单个csv文件内所有的TRACK_ID
    print(argoverse_forecasting_data.city)    # 输出单个csv文件内的城市名
    print(argoverse_forecasting_data.num_tracks)  # 输出单个csv文件内的轨迹数量
    print(argoverse_forecasting_data.seq_df)  # 以pd.DataFrame类型输出csv文件的数据信息
    print(argoverse_forecasting_data.agent_traj)  # 以numpy.ndarray类型输出agent的轨迹
部分结果如下图所示:

2.2绘制可视化图片
绘制可视化图形代码如下,其中的viz_sequence是argoverse.visualization.visualize_sequences中写好的函数。
from argoverse.visualization.visualize_sequences import viz_sequence
import os
import matplotlib.pyplot as plt
# seq_path = f"{root_dir}/2645.csv"
# viz_sequence(afl.get(seq_path).seq_df, show=True)
# seq_path = f"{root_dir}/3828.csv"
# viz_sequence(afl.get(seq_path).seq_df, show=True)
# 确保保存目录存在
save_dir = "save_pics"
os.makedirs(save_dir, exist_ok=True)
# 可视化第一个序列并保存
seq_path = f"{root_dir}/2645.csv"
viz_sequence(afl.get(seq_path).seq_df, show=False)  # 不显示图形,直接保存
plt.savefig(os.path.join(save_dir, "sequence_2645.png"))  # 保存图像
plt.close()  # 关闭图形以释放内存
生成的结果图如下:

2.3使用map_api
获取代理轨迹的候选中心线是一个简单的函数调用。下面我们使用轨迹的前 2 秒来计算接下来 3 秒的候选中心线。map_api文件的函数有很多,**ArgoverseMap()**是里面的一个类,这里不展开讨论。
from argoverse.map_representation.map_api import ArgoverseMap

avm = ArgoverseMap()

obs_len = 20

index = 2
seq_path = afl.seq_list[index]
agent_obs_traj = afl.get(seq_path).agent_traj[:obs_len]
candidate_centerlines = avm.get_candidate_centerlines_for_traj(agent_obs_traj, afl[index].city, viz=True)

index = 3
seq_path = afl.seq_list[index]
agent_obs_traj = afl.get(seq_path).agent_traj[:obs_len]
candidate_centerlines = avm.get_candidate_centerlines_for_traj(agent_obs_traj, afl[index].city, viz=True)
生成的结果图如下:

 想要将图片保存下来,直接加plt.savefig(filename)貌似不行,保存下来的是空白。目前找到的方法需要修改map_api文件的get_candidate_centerlines_for_traj函数代码,目前我个人解决方案是下图。

2.4获取轨迹坐标的车道方向
和2.3相似,也是通过**ArgoverseMap()**类里面的函数调用得到的。
index = 2
seq_path = afl.seq_list[index]
agent_traj = afl.get(seq_path).agent_traj
lane_direction = avm.get_lane_direction(agent_traj[0], afl[index].city, visualize=True)

index = 3
seq_path = afl.seq_list[index]
agent_traj = afl.get(seq_path).agent_traj
lane_direction = avm.get_lane_direction(agent_traj[0], afl[index].city, visualize=True)
结果图如下:


3.结束语
这是一个简单的使用python对 Argoverse 预测数据集教程。如有不足,请指出。


 733
733


 到【灌水乐园】发言


