


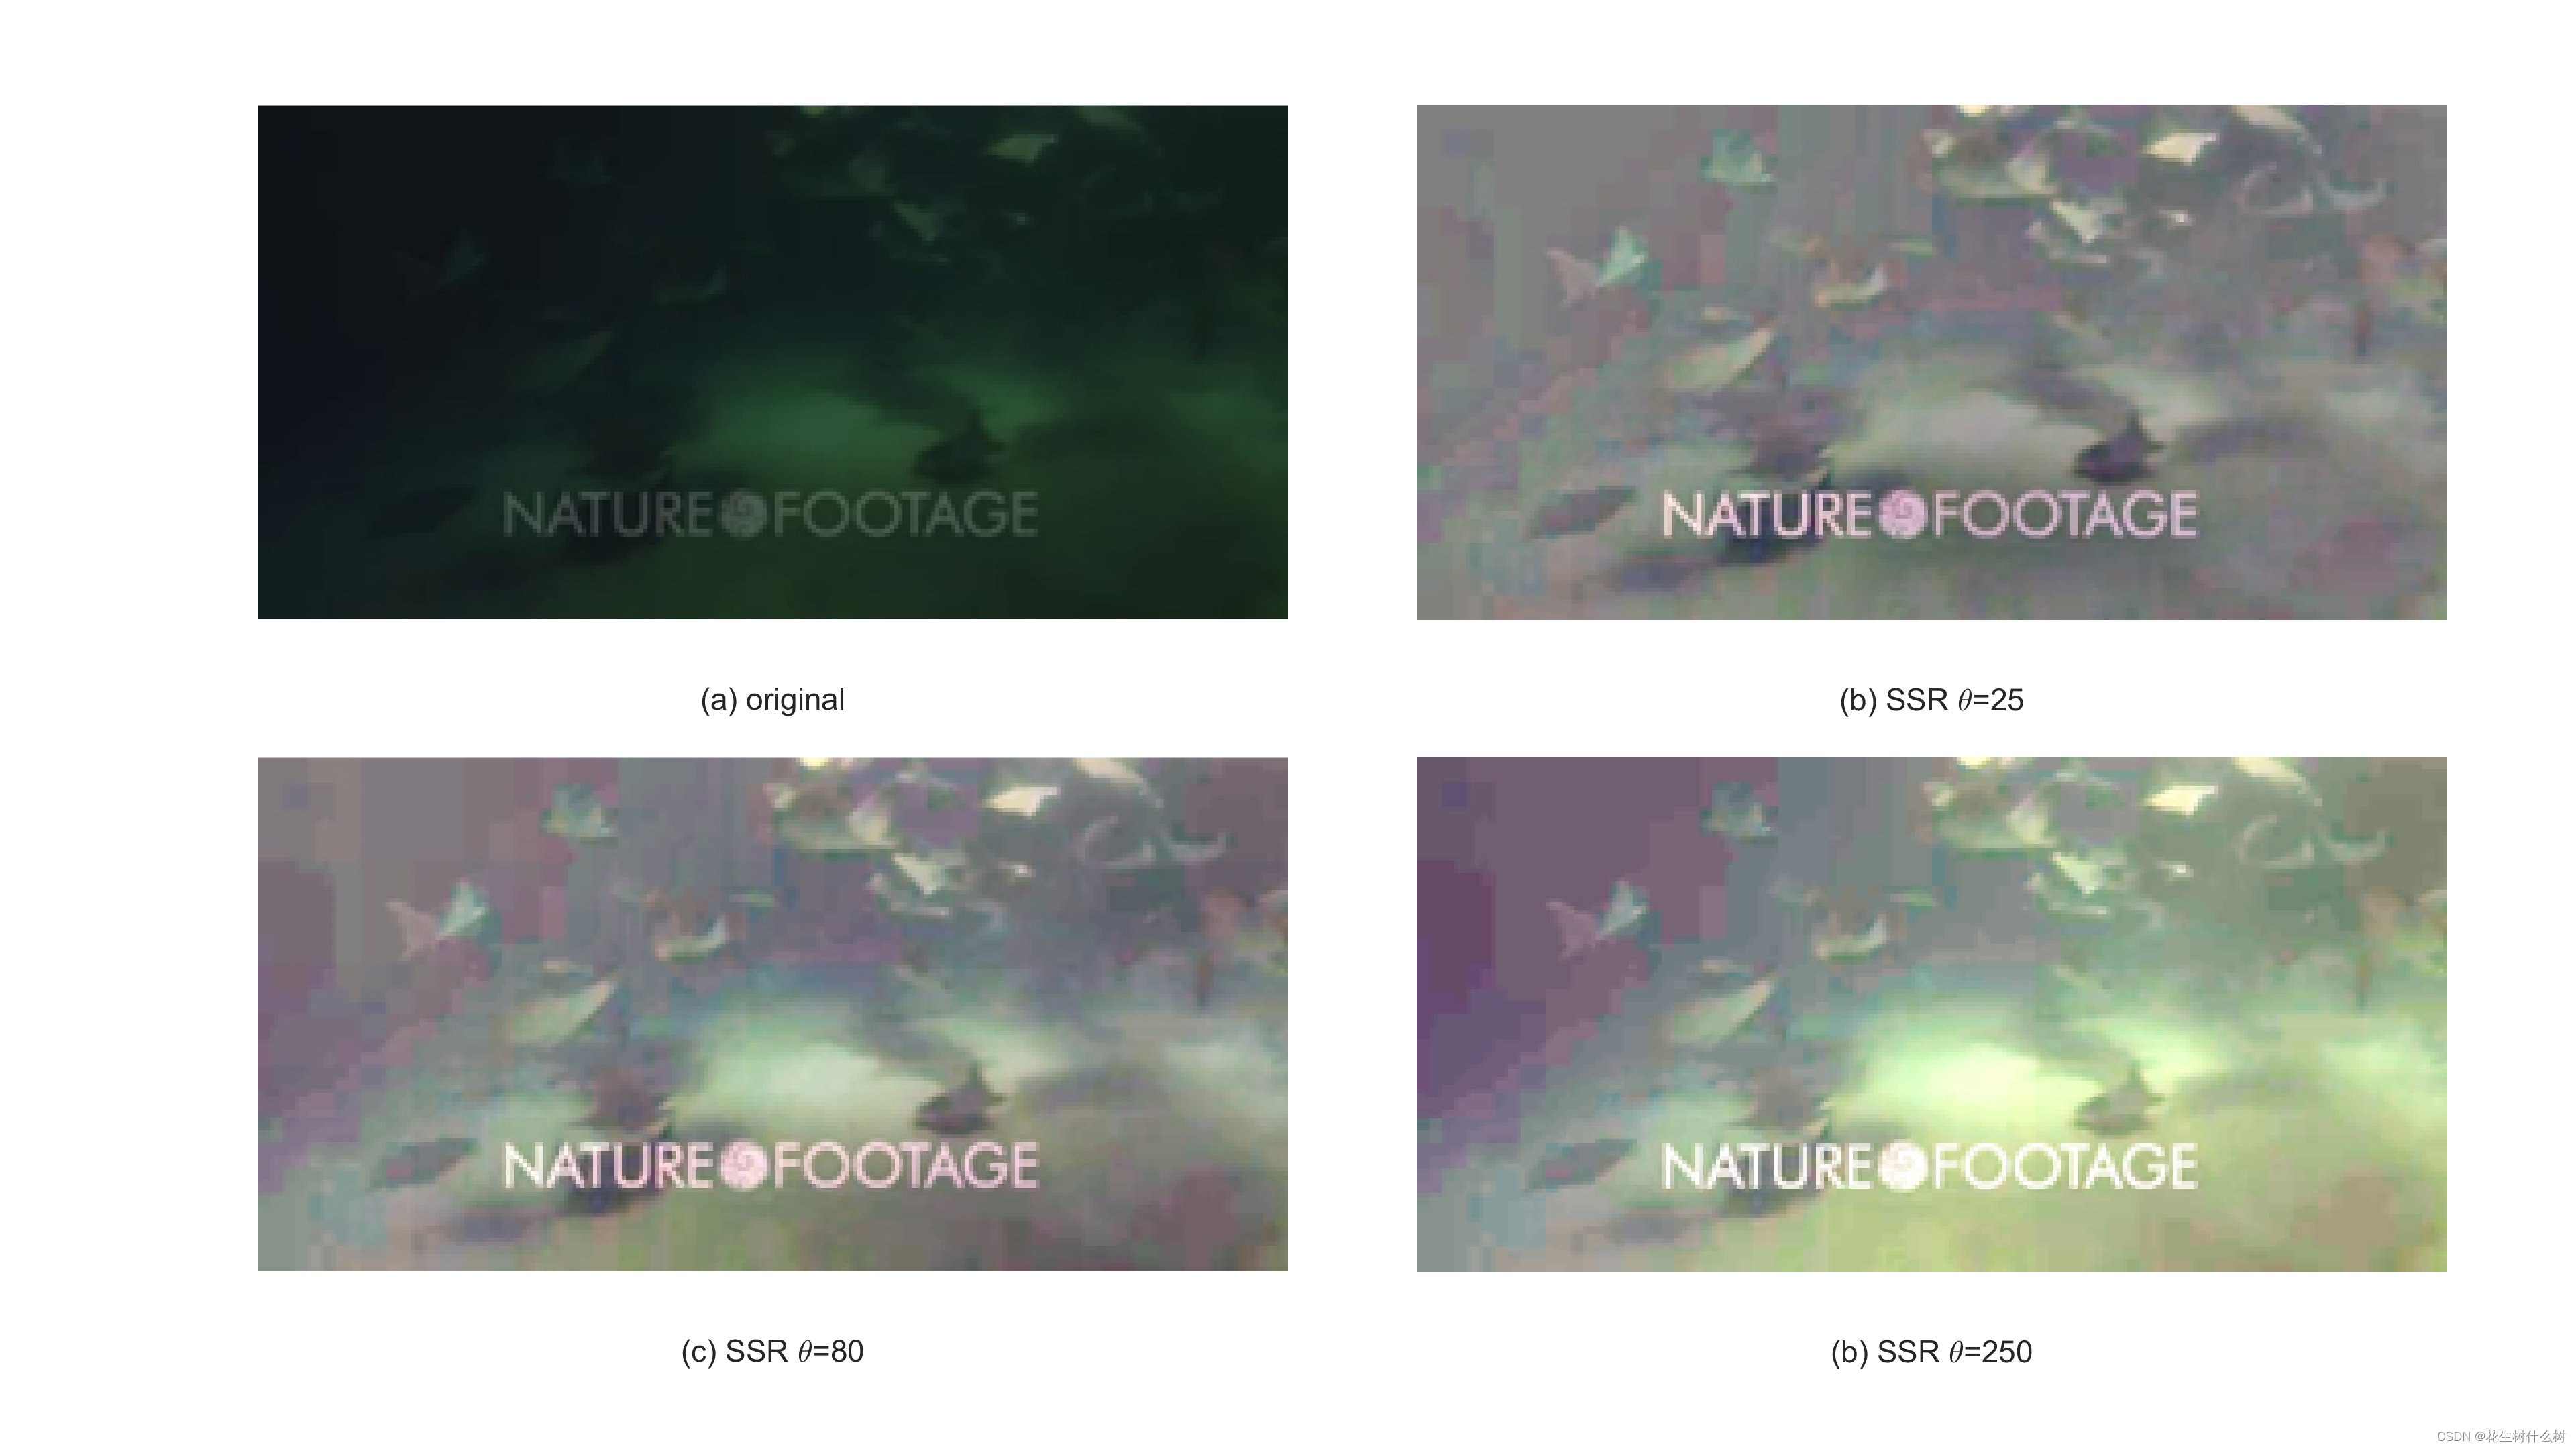
 这段代码在MATLAB环境中加载四张图片,并以2x2的网格布局显示。每个子图展示原始图像和经过不同SSR(可能是一种图像增强技术,参数为25、80和250)处理后的效果。最后,调整子图间距并保存结果为PNG文件。
源码:
% Load four images
img1 = imread('Img/Pic4_6/1.png');
img2 = imread('Img/Pic4_6/2.png');
img3 = imread('Img/Pic4_6/3.png');
img4 = imread('Img/Pic4_6/4.png');

% Create a 2x2 grid of subplots
figure;
subplot('position',[0.1 0.55 0.4 0.4]); imshow(img1); xlabel('(a) original');
subplot('position',[0.55 0.55 0.4 0.4]); imshow(img2); xlabel('(b) SSR \theta=25');
subplot('position',[0.1 0.1 0.4 0.4]); imshow(img3); xlabel('(c) SSR \theta=80');
subplot('position',[0.55 0.1 0.4 0.4]); imshow(img4); xlabel('(b) SSR \theta=250');

% Adjust the spacing between subplots
set(gcf,'units','normalized','position',[0.1 0.1 0.8 0.8]);
set(gcf,'defaultaxesposition', [0.1, 0.1, 0.35, 0.35]);
set(gcf,'defaultaxesfontsize', 12);
set(gcf,'defaultaxestitlefontsize', 14);
set(gcf,'defaultlinelinewidth', 1.5);
set(gcf,'defaultfigurecolor',[1 1 1]);
set(gcf,'defaultfigureinverthardcopy','off');

% Save the figure as a PNG file
print('4_6.png','-dpng','-r300');
结果显示:


 5268
5268

 被折叠的 条评论
为什么被折叠?
被折叠的 条评论
为什么被折叠?
 到【灌水乐园】发言


