import pandas as pd
import matplotlib.pyplot as plt
data = pd.read_csv('iris.csv')
data.head()
Sepal.Length
Sepal.Width
Petal.Length
Petal.Width
Species
0
5.1
3.5
1.4
0.2
setosa
1
4.9
3.0
1.4
0.2
setosa
2
4.7
3.2
1.3
0.2
setosa
3
4.6
3.1
1.5
0.2
setosa
4
5.0
3.6
1.4
0.2
setosa
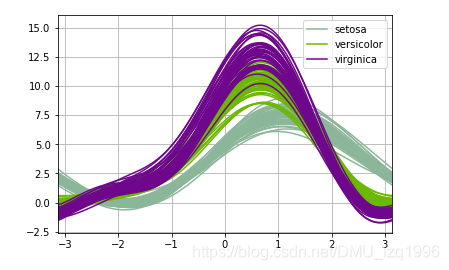
from pandas.tools.plotting import andrews_curves
plt.figure()
andrews_curves(data,'Species')
C:\Anaconda\lib\site-packages\ipykernel_launcher.py:3: FutureWarning: 'pandas.tools.plotting.andrews_curves' is deprecated, import 'pandas.plotting.andrews_curves' instead.
  This is separate from the ipykernel package so we can avoid doing imports until


<matplotlib.axes._subplots.AxesSubplot at 0x194bc953a20>
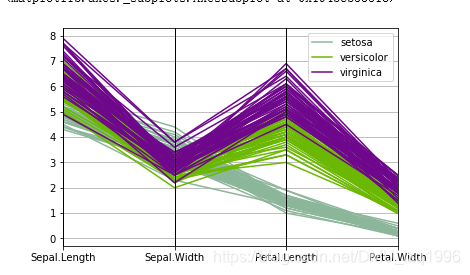
from pandas.tools.plotting import parallel_coordinates
plt.figure()
parallel_coordinates(data,'Species')
C:\Anaconda\lib\site-packages\ipykernel_launcher.py:3: FutureWarning: 'pandas.tools.plotting.parallel_coordinates' is deprecated, import 'pandas.plotting.parallel_coordinates' instead.
  This is separate from the ipykernel package so we can avoid doing imports until


<matplotlib.axes._subplots.AxesSubplot at 0x194bcb53518>
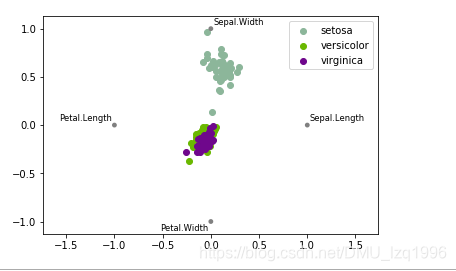
from pandas.tools.plotting import radviz
plt.figure()
radviz(data,'Species')
C:\Anaconda\lib\site-packages\ipykernel_launcher.py:3: FutureWarning: 'pandas.tools.plotting.radviz' is deprecated, import 'pandas.plotting.radviz' instead.
  This is separate from the ipykernel package so we can avoid doing imports until


<matplotlib.axes._subplots.AxesSubplot at 0x21ead4859b0>


 9587
9587

 被折叠的 条评论
为什么被折叠?
被折叠的 条评论
为什么被折叠?
 到【灌水乐园】发言


