


Aaapenal is very simple and easy to use. Today we will talk about the specific functions of the Aaapenal panel.
Sys Status :
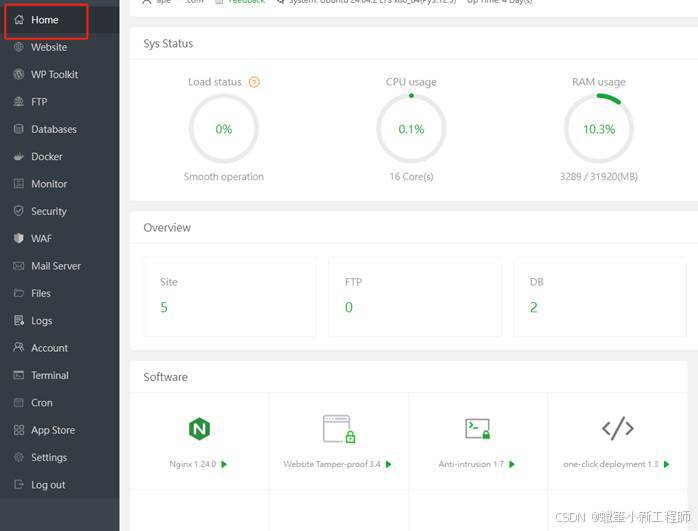
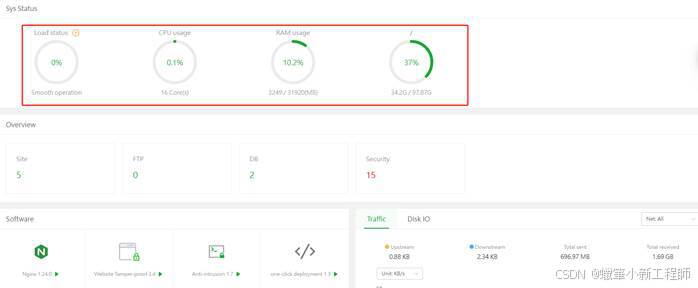
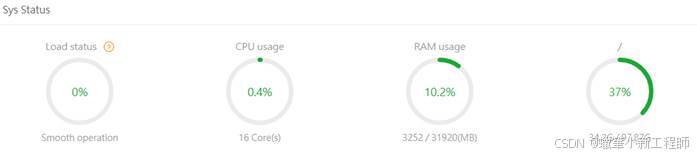
The Sys Status on the aaPanel control panel homepage usually displays the real-time status of the following system resources:
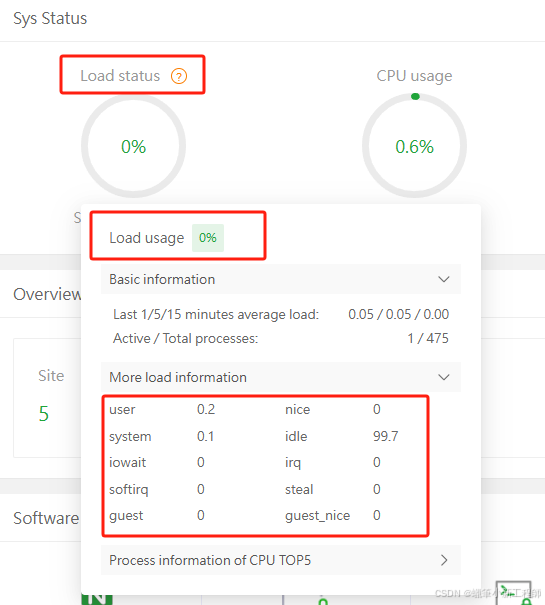
- Load Status : Displays the current load status of the system to help users understand the operating pressure of the server.
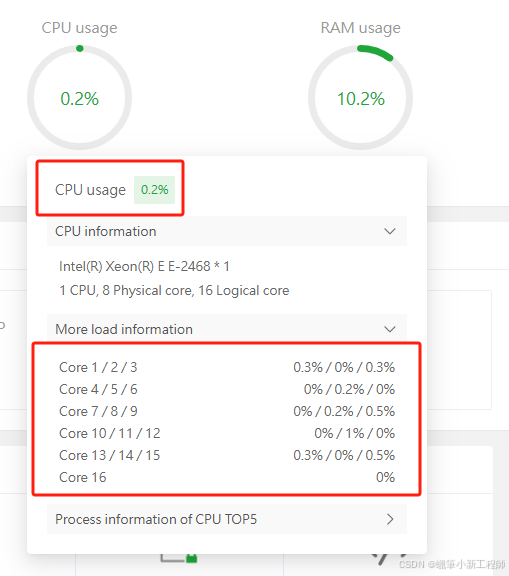
- CPU Usage : Displays CPU usage, making it easy to monitor processor performance.
- RAM Usage : Displays memory usage to help users manage memory resources.
- Disk Space : Displays disk space usage to ensure sufficient storage resources.
That's right! In the aaPanel control panel, the status of these servers is usually displayed in an intuitive circular chart. The visual design of the pie chart allows users to understand the current system health status at a glance, such as the usage of CPU, RAM, disk space, and system load. This design is not only beautiful, but also very practical, especially suitable for administrators who need to quickly check the system operation status.
In terms of Smooth Operation , aaPanel can monitor the following key server conditions to ensure stable system operation:
- System Load (Load Average) : Displays whether the server 's processing capacity is overloaded.
- CPU Usage : Understand processor usage to prevent performance degradation caused by overuse.
- Memory (RAM) usage : Monitor available memory to avoid problems caused by insufficient memory.
- Disk Usage : Tracks storage resources to ensure there is enough space to run programs.
- Network Traffic : View inbound and outbound traffic in real time to help diagnose network connection problems or potential DDoS attacks.
- Running Processes : Provides a list of active processes on the current server to facilitate troubleshooting .
- Service Status : Displays the start or stop status of key services (such as Web server, database, etc.).
CPU problems can show the CPU health status
By analyzing the CPU usage , you can understand the following server operating conditions and potential problems:
- Computing resource pressure : Check whether the CPU is under long-term high load, which may mean that the server needs more resources or some applications are consuming too much computing power.
- Process operation status : Determine which processes (applications or services) consume the most CPU resources, and help locate resource-intensive operations or potential abnormal processes.
- Performance bottleneck : If the CPU usage is close to 100%, it may be a system bottleneck; you need to check whether there are code optimization issues or hardware upgrade requirements.
- Multi-core utilization : Analyze whether each core of the multi-core CPU is loaded evenly. If some cores are too busy while others are idle, task allocation optimization may be needed.
- Regular fluctuations : Checks whether CPU usage has regular peaks and valleys to help identify load increases caused by specific periods of traffic or activity.
- Temperature and pressure
Long-term high usage will cause the CPU to overheat and affect the life of the hardware, so it is also important to monitor the CPU's stress and heat dissipation conditions.
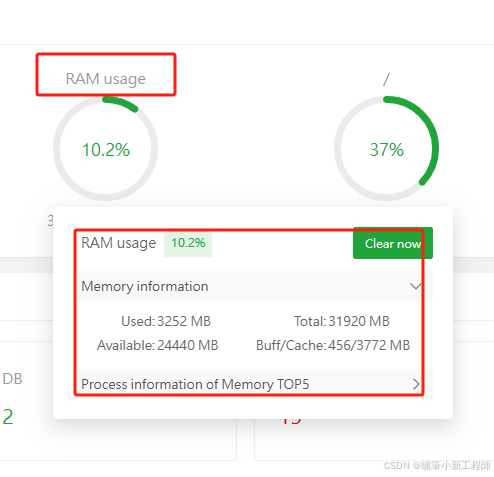
By analyzing RAM usage , we can understand the following key conditions of the server:
- Memory usage : Determine if current memory usage is too high to avoid causing system crashes or performance degradation.
- Memory idle rate : If a large amount of memory is idle, it may indicate that resources are unevenly allocated or the configuration is too conservative, and memory allocation needs to be optimized.
- Process memory usage : Understand which processes or applications are using more memory to locate possible memory leaks or high memory consuming processes.
- Cache and cache eviction : The amount of data cached in RAM helps performance, but it can lead to insufficient memory if the cache is not evicted in a timely manner.
- Swap : When memory is insufficient, the system may use the swap partition as virtual memory. If you find that your swap partition is being used frequently, you may need to upgrade your memory or reduce the load.
- Memory Trend : Analyze memory usage trends to help predict future memory requirements and prevent insufficient memory issues.
- Memory Error : Checks for memory errors, which may be related to hardware failure and require prompt attention.
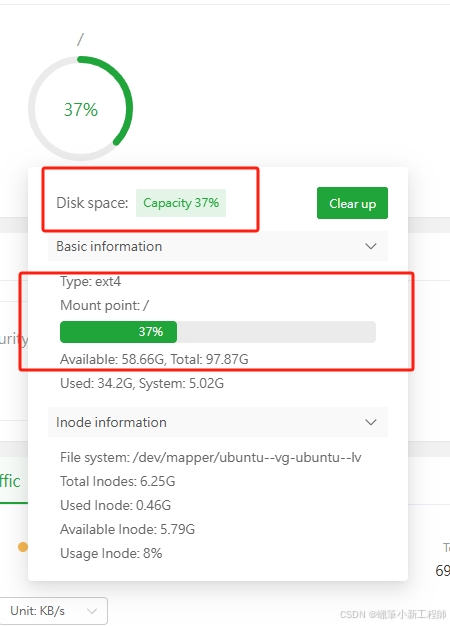
By analyzing the disk space , you can understand the following important server conditions:
- Disk usage : Check the used and remaining space on the disk to prevent system crashes or performance issues caused by insufficient disk space.
- File Distribution : Analyze which file types (such as log files, database files, or temporary files) consume the most disk space, helping to optimize storage allocation.
- Junk Files : Scan and clean unnecessary temporary files or expired backups to make more free space.
- Disk performance : Evaluate the disk's read and write speeds and response times to ensure that the disk can meet the needs of current applications.
- Disk partition usage : View the usage of each partition to help determine whether space needs to be reallocated or partitions need to be expanded.
- Disk Health : Check the hardware health of the disk (such as SMART data) to prevent potential disk failures.
- Abnormal growth
These intuitive monitoring charts and indicators allow us to grasp the health of the server in a short period of time. Whether it is Load Status, CPU, RAM or disk space, these data are presented at a glance, allowing us to detect anomalies immediately and take necessary actions. Such visualization tools are particularly effective when dealing with unexpected problems or optimizing system performance .
Server Visualization Tools improves operational efficiency on multiple levels by providing critical data and intuitive displays in real time, including:
- Rapid decision-making capabilities : Administrators gain instant insight into server performance, resource usage, and potential issues, allowing them to react quickly and reduce downtime.
- Efficient troubleshooting : Clear data visualization and alerting capabilities help quickly locate the source of problems (such as high load, insufficient memory, or insufficient disk space), speeding up the resolution process.
- Resource allocation optimization : Analyze the usage trends of resources such as CPU, RAM, and disk to help enterprises allocate hardware or software resources more effectively and avoid resource waste or shortage.
- Preventive maintenance : Through monitoring data and health assessment, administrators can predict potential hardware failures or overloads and take measures in advance to reduce operational risks.
- Teamwork efficiency : Intuitive interface and charts make it easy to share information with team members, promoting better collaboration and communication.
- Performance optimization and continuous improvement : Through data analysis and long-term trend tracking, we can identify performance bottlenecks and optimize them to improve overall system efficiency.
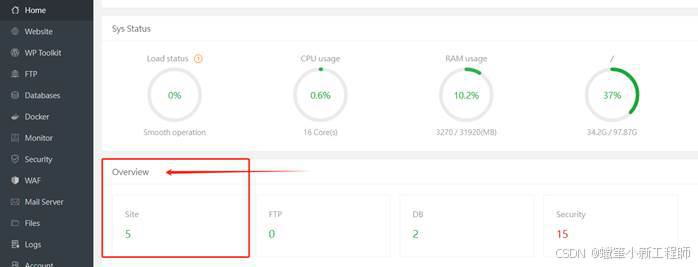
The Overview in the server management interface usually displays the following main server status and information to help administrators quickly understand the overall situation:
- Basic system information :
- Server operating system and kernel version.
- System startup time (Uptime).
- System resource status :
- CPU usage (total usage and per core).
- RAM usage.
- Disk space usage (total and partitioned).
- System load (Load Average).
- Network traffic :
- Real-time network traffic (uplink and downlink data).
- Daily or monthly total traffic records.
- Service Status :
- The operation status of key services (such as Nginx, MySQL, etc.).
- Are there any services that are not started or stopped abnormally?
- Safety Information :
- Recent login records.
- A brief status of the system firewall or security policy.
- Alert or Notification :
- Alerts for abnormal data, such as insufficient memory, exhausted disk space, etc.
This information is often presented in the form of graphs or summary data for quick review.
In the server's web management interface, the website management section usually provides the following functions and information to help users manage the website effectively:
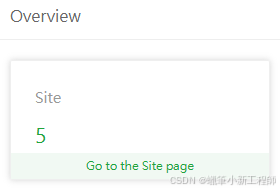
- Website Overview :
- Displays the total number of hosted websites ( such as "Site: 5" on the interface ) .
- Links to quickly access website administration pages (such as "Go to the Site page").
- Website settings :
- Add, delete, or modify settings for hosted websites.
- Configure domain name binding and subdomain management .
- SSL/TLS configuration :
- Manage SSL/TLS certificates for your website to ensure a secure connection.
- Access log and error log :
- View the website's access and error records to help troubleshoot problems .
- Flow and performance data :
- Real-time monitoring of website traffic, response time and other performance indicators.
- Security Policy :
- Configure firewall rules or enable security protection to prevent illegal access.
- Database support :
- Quickly access database management tools associated with your website.
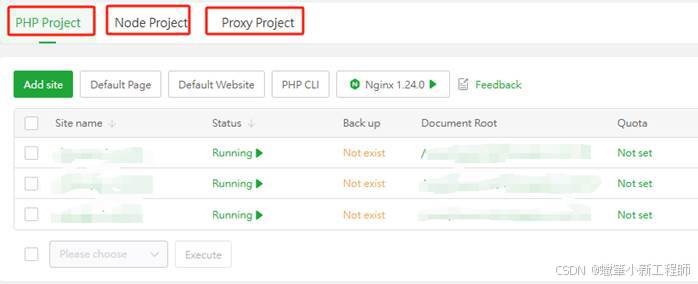
These three main services play different roles to help users efficiently manage servers and related projects:
- PHP Project : Mainly used to manage and deploy PHP-based projects. It supports configuring the PHP environment, monitoring the running status of PHP programs , and debugging functions , making the development and operation of PHP applications more convenient.
- PHP Project Proxy : This service is commonly used to set up and manage proxy services to help handle traffic distribution, load balancing, or data exchange across a network. It improves performance and enhances the scalability of your application.
- Proxy Project : Focuses on the management of proxy servers , such as setting up a reverse proxy or configuring network traffic routing. This is very helpful for optimizing website access speed, strengthening security, and improving user experience.
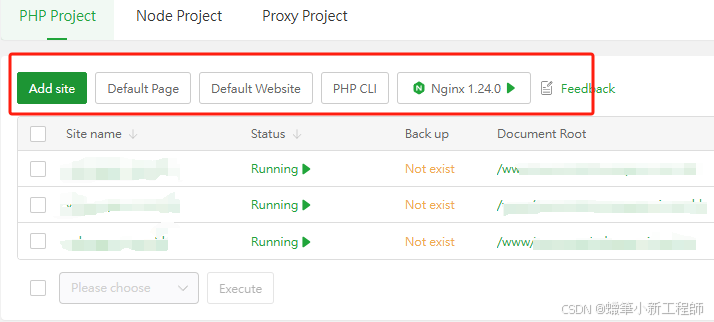
the red circles in the picture , the following is an analysis of the various functions in the PHP project management interface :
- Add site :
- Used to quickly add a new PHP project site, making it easier for users to manage multiple sites.
- You will usually be prompted to configure the site's domain name, root directory, and other related parameters.
- Default Page :
- Manage or set the default homepage for the site, such as index.php or other user-specified files.
- It can ensure that when visiting the site, you are correctly redirected to the main page designed by the user.
- Default Website :
- Set a default website to handle requests that do not explicitly specify a domain name.
- Usually suitable for servers in a multi-domain environment.
- PHP CLI (PHP Command Line Interface) :
- Provides direct access to the PHP command line, supporting running PHP instructions or scripts for testing and debugging .
- Nginx 1.24.0 (Web server version information) :
- Displays the Nginx version used by the server, which helps confirm software compatibility and feature support.
- Click to further configure Nginx related parameters.
- Site List Area :
- Lists all hosted sites, including:
- Site name (such as vlws.apex-i.com.hk, vmws.apex-i.com.hk, etc.).
- Running status : For example, Running means the site is running.
- Backup status : Displays whether there is a backup of the site (currently all three sites show Not exist, indicating that they have not been backed up).
- Document root : Provides the location where files for each site are stored (for example, /www/ wwwroot /).
- Lists all hosted sites, including:
- Bottom operation function :
- Please choose : A drop-down option may be provided, such as bulk management of sites, starting or stopping services , etc.
- Execute : Used to execute the selected operation.
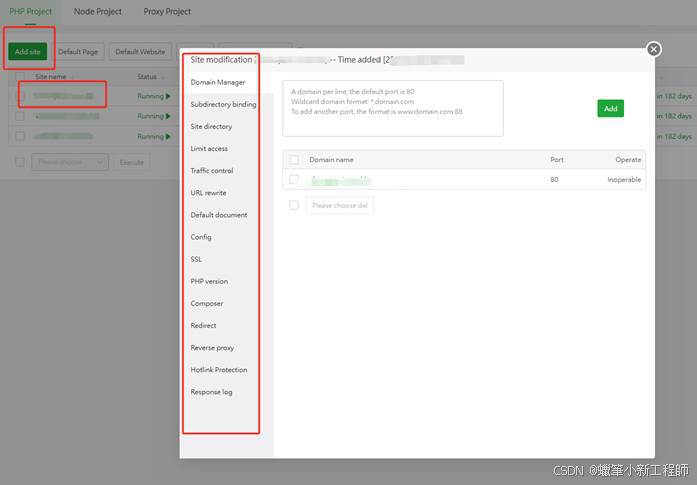
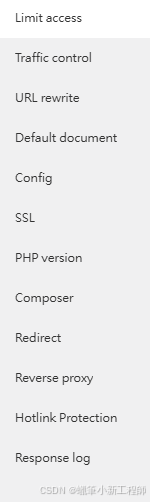
After entering the website management interface, the management items marked with red circles in the left column include:
- Domain Manager
- Subdirectory binding
- Site directory
- Limit access
- Traffic control
- URL rewrite
- Default document
- Config
- SSL ( SSL Settings )
- PHP version
- Composer ( Composer management tool)
- Redirect
- Reverse proxy
- Hotlink Protection
- Response log
These projects cover comprehensive management of the website, from basic settings to security configuration, helping users operate and optimize the website more efficiently .
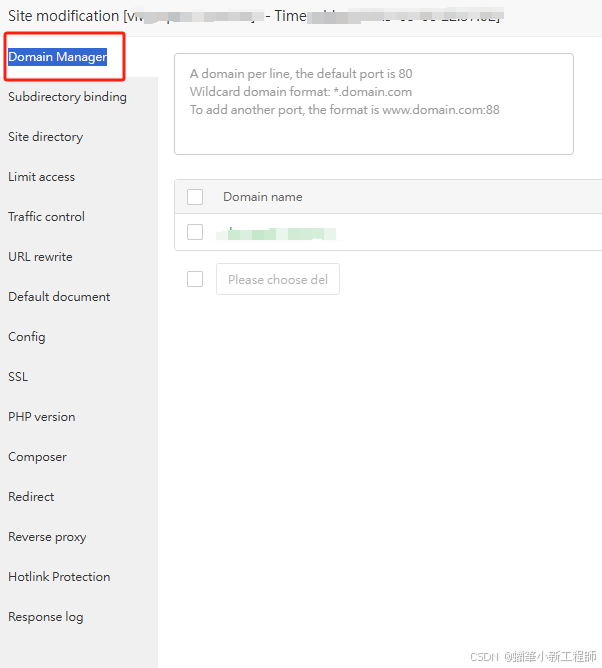
Domain Manager
It is not just about binding different domain names, it can also handle the following other operations to fully manage the domain configuration of the website:
- Multiple domain name binding : You can bind multiple domain names to the same site, such as the primary domain name and subdomain names , to facilitate different access needs.
- Subdomain management : allows for individual binding or setting of subdomains , suitable for the needs of multi-site architecture.
- Domain name redirection :
- Set the redirection rules between domain names , for example, www.example.com automatically redirects to example.com.
- Configure HTTPS redirection to improve security.
- Alias configuration : Set up domain aliases to support multiple domain names pointing to the same website.
- Domain name resolution check :
- Verify that the domain name has been correctly resolved to the server IP.
- Provides diagnosis and hints for parsing problems.
- Backup and Restore : Configurations related to domain names can be backed up and restored when needed.
- SSL certificate support : Bind SSL/TLS certificates to domain names to ensure secure HTTPS access.
- Anti-hotlink settings : Combined with domain name management, restrict unauthorized external websites from using your resources.
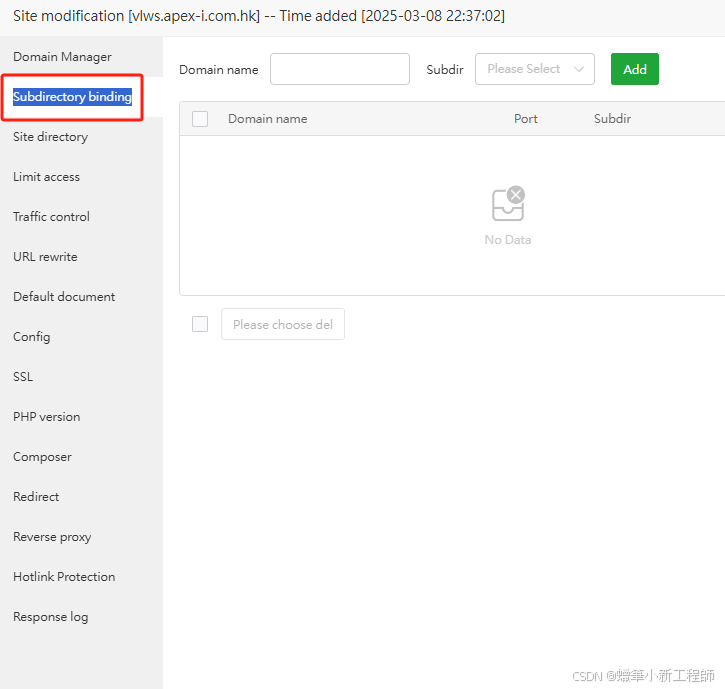
Subdirectory binding
The functions mainly handle the following tasks, which are especially useful in multi-purpose website configurations:
Subdirectory mapping domain name:
Bind a specific domain name or subdomain to a subdirectory of a website, for example, example.com/blog is bound to blog.example.com.
Multi-site management:
You can manage different subdirectories of the same main site as independent sites , for example, example.com/app and example.com/shop can each have different configurations and environments.
Resource isolation:
Different subdirectories can be configured with their own PHP versions or special settings to achieve environmental isolation and improve the flexibility and security of the website.
Access Control:
Configure access permissions for subdirectories, restrict access to certain user groups, or set password protection.
Traffic Optimization:
Direct specific traffic to different subdirectories to improve resource utilization and response efficiency.
Subdirectory rewriting and redirection :
Set URL rewriting rules to facilitate search engine optimization (SEO) and achieve a user-friendly link structure.
Security Management:
Bind HTTPS (SSL certificate) to the subdirectory to protect data transmission security.
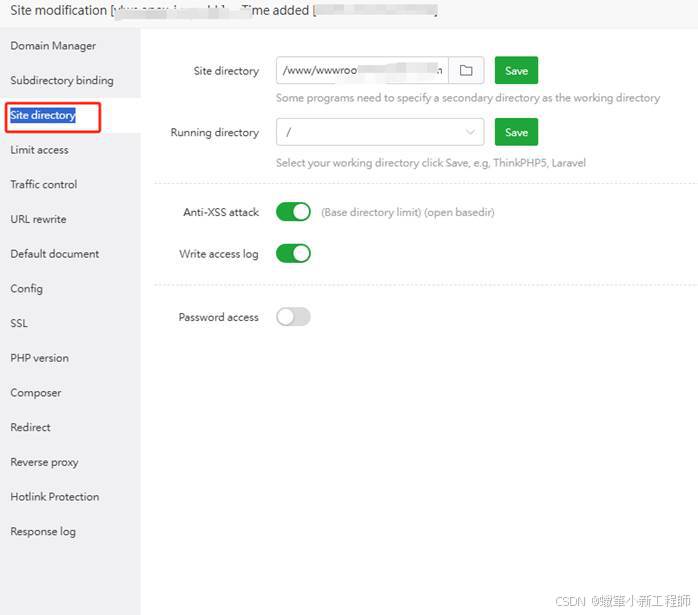
the site directory is to provide flexibility and security in the root directory management and directory configuration of the website. Here are its main functions:
- Management website file location :
- Used to set the root directory of the website (for example, /www/ wwwroot / yourwebsite ) and determine the storage path of static and dynamic files for all websites.
- Run directory setup :
- Set the running directory of the website (such as / or a specified subdirectory) to allow the system to correctly process and execute the application.
- Preventing XSS attacks :
- Provides Anti-XSS attack options to limit the execution scope of specific directories (such as open_basedir ), prevent cross-site scripting attacks , and enhance security.
- Access logging :
- Enable or disable the Write access log function to record access activities within the directory for troubleshooting or traffic analysis.
- Password Protection :
- Enable Password access to set a password for the directory to prevent unauthorized access.
Website and server management related, including the following:
- Limit access
- Control access rights to specific users or IP addresses for enhanced security.
- Traffic control
- Manage and limit traffic usage to ensure server resources are not abused.
- URL rewrite
- Configure URL rewriting rules to optimize the website's link structure and improve SEO results.
- Default document
- Set the default loading file when the website is visited, such as index.html or index.php .
- Config
- Edit and manage the server's configuration files for more flexible customization.
- SSL ( SSL Settings )
- Install and manage SSL/TLS certificates to protect the security of data transmission.
- PHP version
- Manage the website's PHP version to ensure compatibility with website applications.
- Composer ( Composer management tool)
- Manage PHP's dependency packages to facilitate development using third-party libraries .
- Redirect
- Configure the redirect rules for web pages , such as redirecting the old URL to the new URL.
- Reverse proxy
- Configure a reverse proxy to improve website access speed and security.
- Hotlink Protection
- Limit external websites from directly linking to your images or resources to save bandwidth.
- Response log
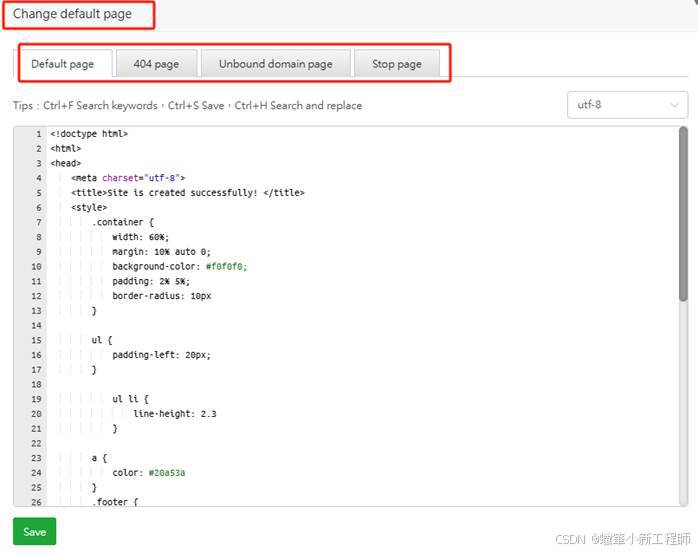
This part of the functionality is mainly used to manage and configure specific page types on the website. Here is an explanation of each function:
- Default page
- Configure the default page of the website, such as the homepage content displayed when accessing the primary domain name (such as index.html or a custom page ) .
- 404 page
- Sets the error page that is displayed when users visit invalid or non-existent pages. It is often used to guide users to return to the home page or other content.
- Unbound domain page
- a domain name that is not bound to the server , a specified page is displayed, prompting the user that the domain name cannot be used or is not configured correctly.
- Stop page
- Used to set the notification page displayed when the website service is suspended or shut down, informing visitors that the website is temporarily unavailable.
The HTML editor at the bottom provides visual page content editing functions, and users can directly write or modify HTML/CSS codes to design these pages. After completing the settings, the user can click the Save button to save the changes.
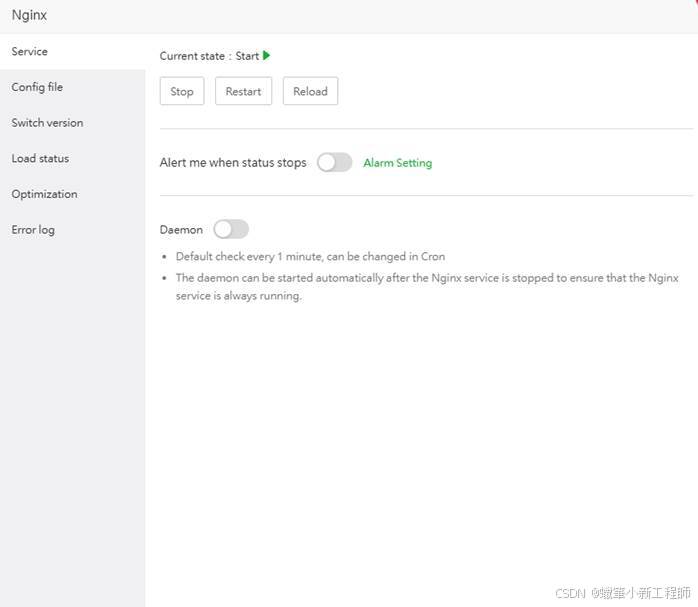
The management and performance assurance of the Nginx service addresses the following key performance aspects:
- Start and manage the Nginx service :
- Provides Stop , Restart and Reload buttons to help users quickly control the running status of the Nginx service.
- Suitable for testing or troubleshooting service issues after modifying configuration files.
- Service status detection and alerts :
- The Alert me when status stops feature can promptly alert users to service anomalies, preventing service interruptions from going unnoticed for a long time.
- Alarm Setting helps users customize notification methods and frequency to ensure service stability.
- Daemon management :
- The default setting is to check the Nginx operation status every minute (this interval can be changed in the Cron task) to ensure that the service is continuously online.
- When the service stops, you can enable the daemon process to automatically restart Nginx to avoid downtime caused by unexpected stops.
- Improved performance stability :
- The daemon and alarm functions complement each other to achieve real-time monitoring and fault recovery, improving the reliability and availability of website services.
These features make Nginx management more efficient and suitable for operational environments that require continuous monitoring and rapid response to problems.
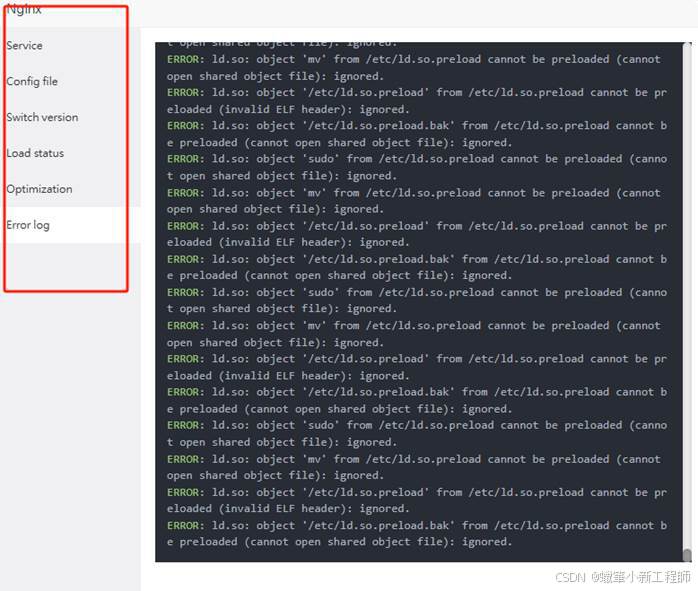
The following is a detailed description of the functions in the left menu:
- Service ( Service Management) :
- Used to start, stop or restart the Nginx service to ensure stable operation of the server.
- Config file :
- Provides the ability to directly edit Nginx configuration files, allowing users to customize server settings such as virtual hosts, routing rules, etc.
- Switch version :
- Supports switching between different versions of Nginx, making it easier to test new version features or roll back to a stable version.
- Load status :
- Monitor Nginx's processing load in real time, including the current number of requests and server resource usage.
- Optimization settings :
- Provides performance optimization tools and suggestions, such as increasing server response speed or processing power.
- Error log :
- View error logs during server operation to help diagnose and solve problems. The error shown in the picture is related to the ELF header or file loading failure of the shared object file . You need to check the content of the /etc/ld.so.preload file and its related configuration .
These functions cover multiple aspects of Nginx operation, configuration, and optimization, helping users to manage servers efficiently.
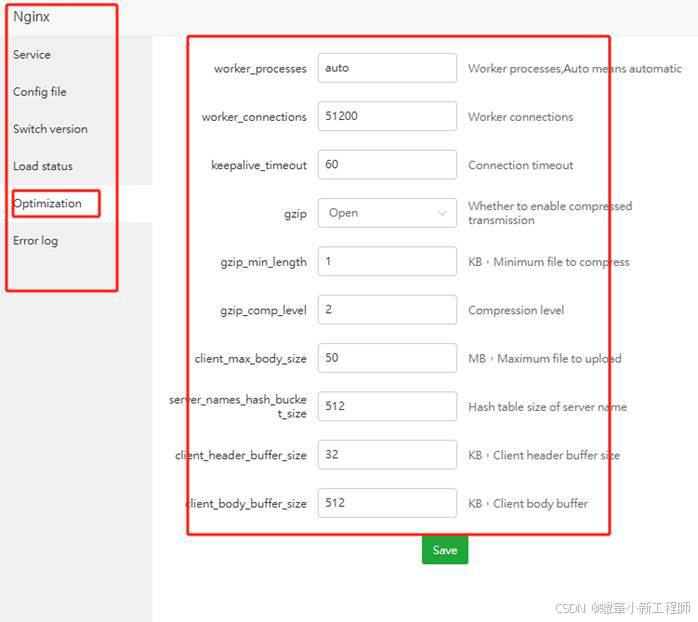
This part is The Nginx Optimization Settings page focuses on server performance tuning and resource management. The following is a description of the specific functions and their effects:
- worker_processes
- Indicates the number of Nginx worker processes. If set to auto, it will automatically adjust according to the number of CPU cores to ensure optimal server performance.
- worker_connections
- Specifies the maximum number of connections that each worker process can handle. For example, 51200 means that each process can handle up to 51200 connections simultaneously , which is used to support high-traffic websites.
- keepalive_timeout (connection timeout )
- Define the timeout period for long connections. Keep the connection active within 60 seconds to reduce the burden of repeated connection establishment.
- gzip ( compressed transmission )
- Enable or disable Gzip compression (currently set to Open), which is used to compress transmitted data and reduce bandwidth usage.
- gzip_min_length (minimum compressed file size)
- Set the minimum size of the file to be compressed, for example, 1 KB. Smaller files will not be compressed to save computing resources.
- gzip_comp_level ( Compression level)
- Defines the strength of the compression (range 1-9), the higher the number the stronger the compression but also increases the CPU load, currently set to 2.
- client_max_body_size (maximum upload file size)
- Limit the maximum size of files that users can upload, currently set to 50 MB.
- server_names_hash_bucket_size ( Server names hash table size)
- Configure the size of the hash table to store server names (such as domain names). A larger value can support more server names. Currently it is set to 512.
- client_header_buffer_size ( Client header buffer size)
- Defines the request header buffer size, currently set to 32 KB to handle large request headers.
- client_body_buffer_size ( Client body buffer size)
- Specifies the size of the request body buffer (currently 512 KB), used to manage the amount of data that needs to be cached .
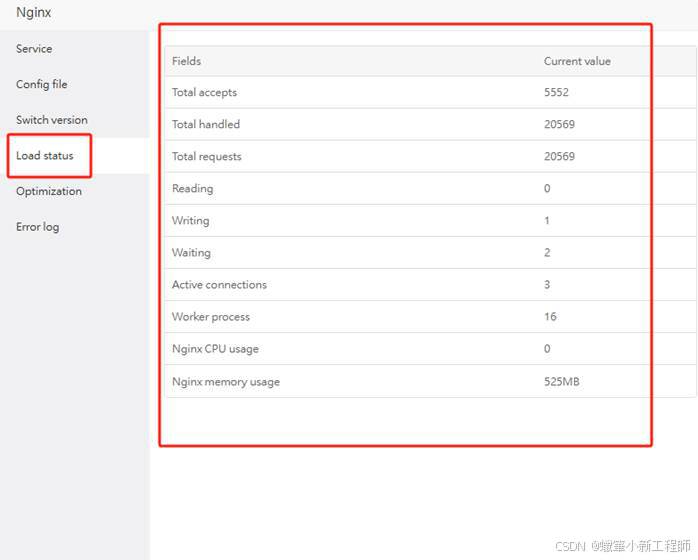
This section is the Nginx load status monitoring interface , which is used to monitor the real-time performance and resource usage status of the Nginx service. The following are the meanings and uses of the specific fields :
- Total accepts : Displays the total number of connections accepted by the server , reflecting the server's connection processing capacity.
- Total handled : This is a count of the total number of connections successfully handled by the server. Ideally this number should be the same as the number accepted. If they are different, there may be a connection loss.
- Total requests : Records the total number of HTTP requests processed by the server to help analyze business request volume.
- Reading : Indicates the number of connections that Nginx is currently reading from client requests .
- Writing : Shows the number of connections that are currently responding to data from the client.
- Waiting : refers to the number of idle connections in the Keep-Alive state .
- Active connections : The total number of currently active client connections , including read, write, and wait connections.
- Worker process : Displays the number of Nginx worker processes , which affects the concurrent processing capability.
- Nginx CPU usage : Monitors the CPU usage of the Nginx process, which is currently 0, indicating that the server is running easily.
- memory usage : Shows the amount of memory used by the Nginx process , helps track memory consumption (currently 525MB ).
These data provide comprehensive monitoring of Nginx operation load and resource usage, helping to quickly locate performance bottlenecks and optimize configuration.
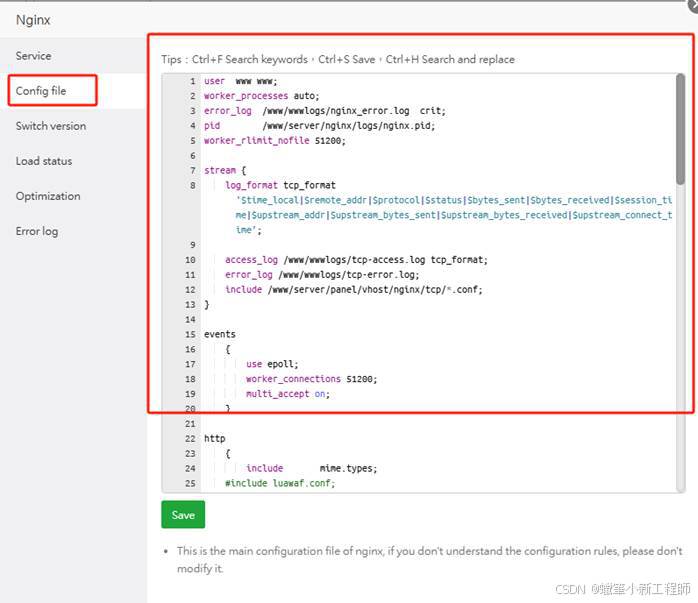
Nginx configuration file , which is used to define Nginx's behavior and various operating parameters. The following is an explanation of the main configuration items in the picture:
- user www www ;
- Specify the user and group for Nginx to run as. Here, it is set to www.
- worker_processes auto;
- Defines the number of Nginx worker processes. auto means automatically adjusting according to the number of CPU cores.
- error_log /www/ wwwlogs /nginx_error.log crit;
- Set the storage path of the error log file and only log errors of severity level (crit).
- pid /www/server/nginx/logs/nginx.pid ;
- Define the PID file path of the Nginx process for process management.
- worker_rlimit_nofile 51200;
- Specifies the maximum number of files that can be opened by each process, set to 51200.
- stream :
- Defines the processing rules for TCP/UDP traffic, supports flow proxy and load balancing.
- log_format : defines the log format and records the key information of the traffic.
- access_log : Sets the access log file location for TCP traffic.
- error_log : Sets the error log file location for TCP traffic.
- include : Include additional configuration files (such as TCP related settings).
- events :
- use epoll ; : Enable the efficient I/O model epoll ( applicable to Linux).
- worker_connections 51200; : Defines the maximum number of connections per worker process .
- multi_accept on; : Allow each worker process to accept multiple new connections at a time.
- http :
- include mime.types ; : Include the MIME type file to guide how to handle different types of files.
- #include luawaf.conf ; : This line is commented out, probably to enable the configuration of Lua Web Application Firewall (WAF).
If you're interested in aaPanel, please visit the official website:www.aapanel.com. I'm happy to provide technical support for you. 😊


 3万+
3万+

 被折叠的 条评论
为什么被折叠?
被折叠的 条评论
为什么被折叠?
 到【灌水乐园】发言


