


背景
uniapp是一个跨端开发框架,可以使用vue开发可发布到iOS、Android、Web(响应式)、以及各种小程序(微信/支付宝/百度/头条/飞书/QQ/快手/钉钉/淘宝)、快应用等多个平台。
最近在写一个分析的需求的时候,小程序端需要使用到图表做可视化呈现。特此记录使用uniapp开发微信小程序引入echarts的过程。
引入组件
想在uniapp中使用echarts需要先引入echarts。我们可以到uniapp官方插件市场(链接见文末)搜索echarts-for-wx:
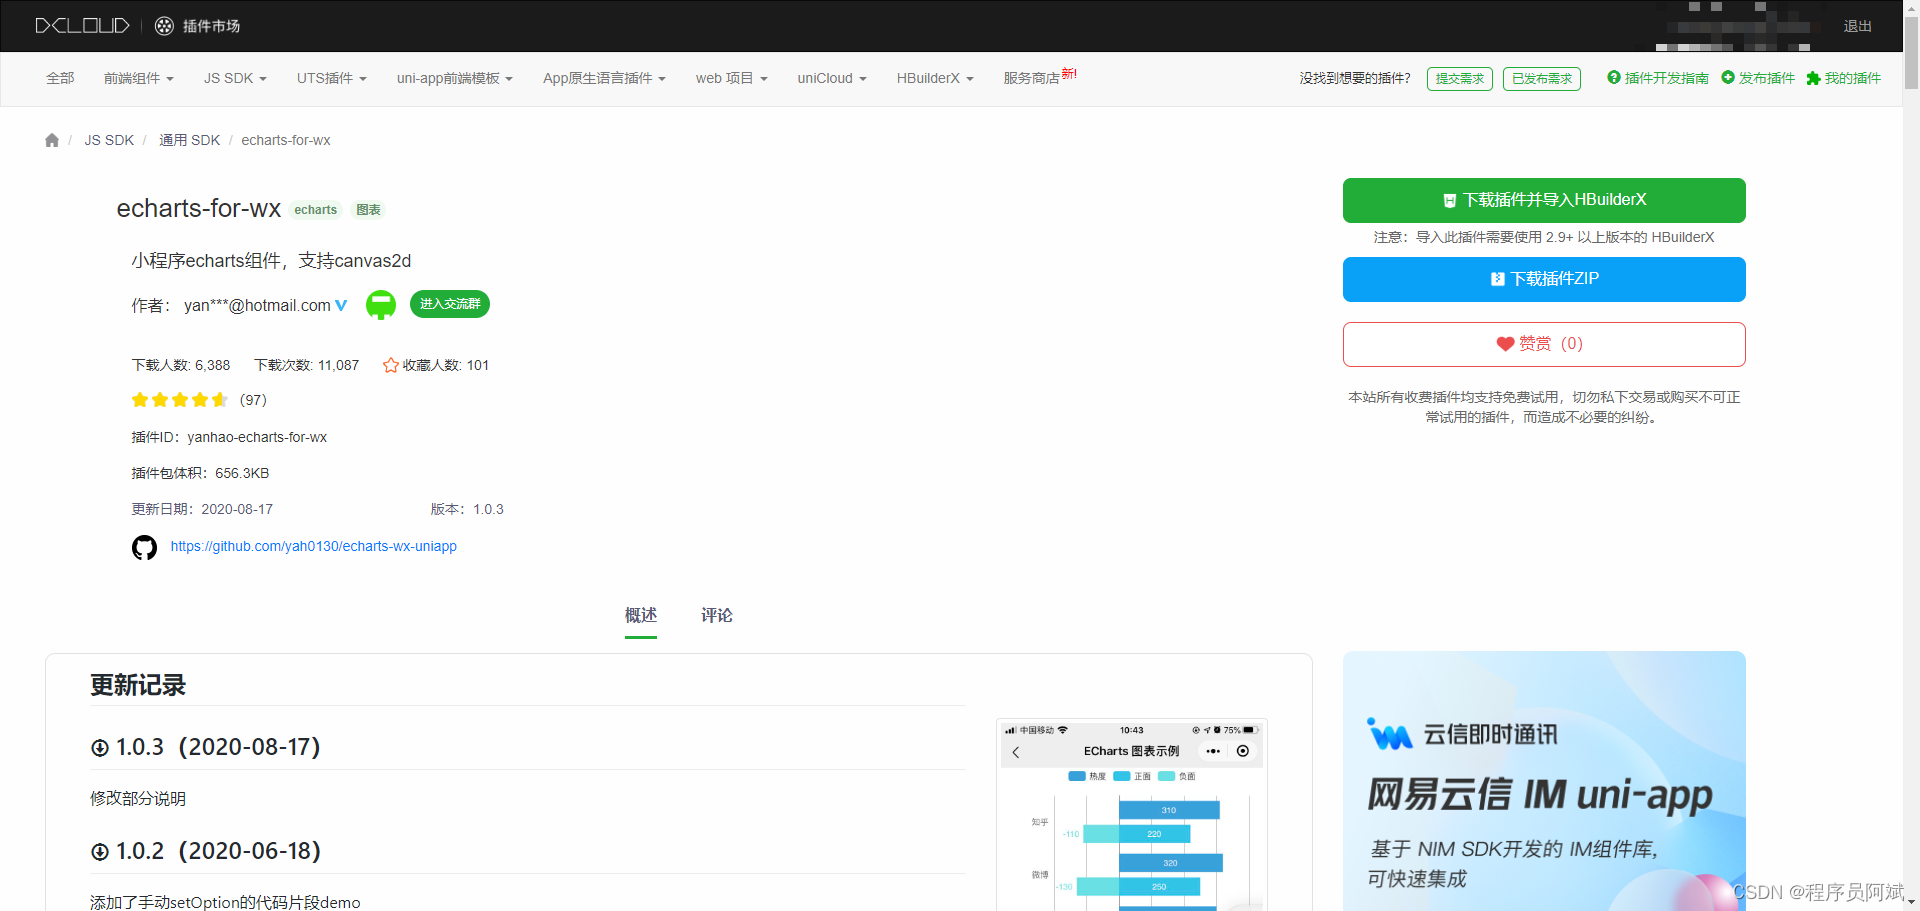
搜索到结果后可以下载zip包自己手动引入,也可以点击”下载插件并导入HBuilderX“自动引入。这里我们选择下载zip包手动引入。点击下载插件ZIP,下载完成之后插件压缩包目录如下:
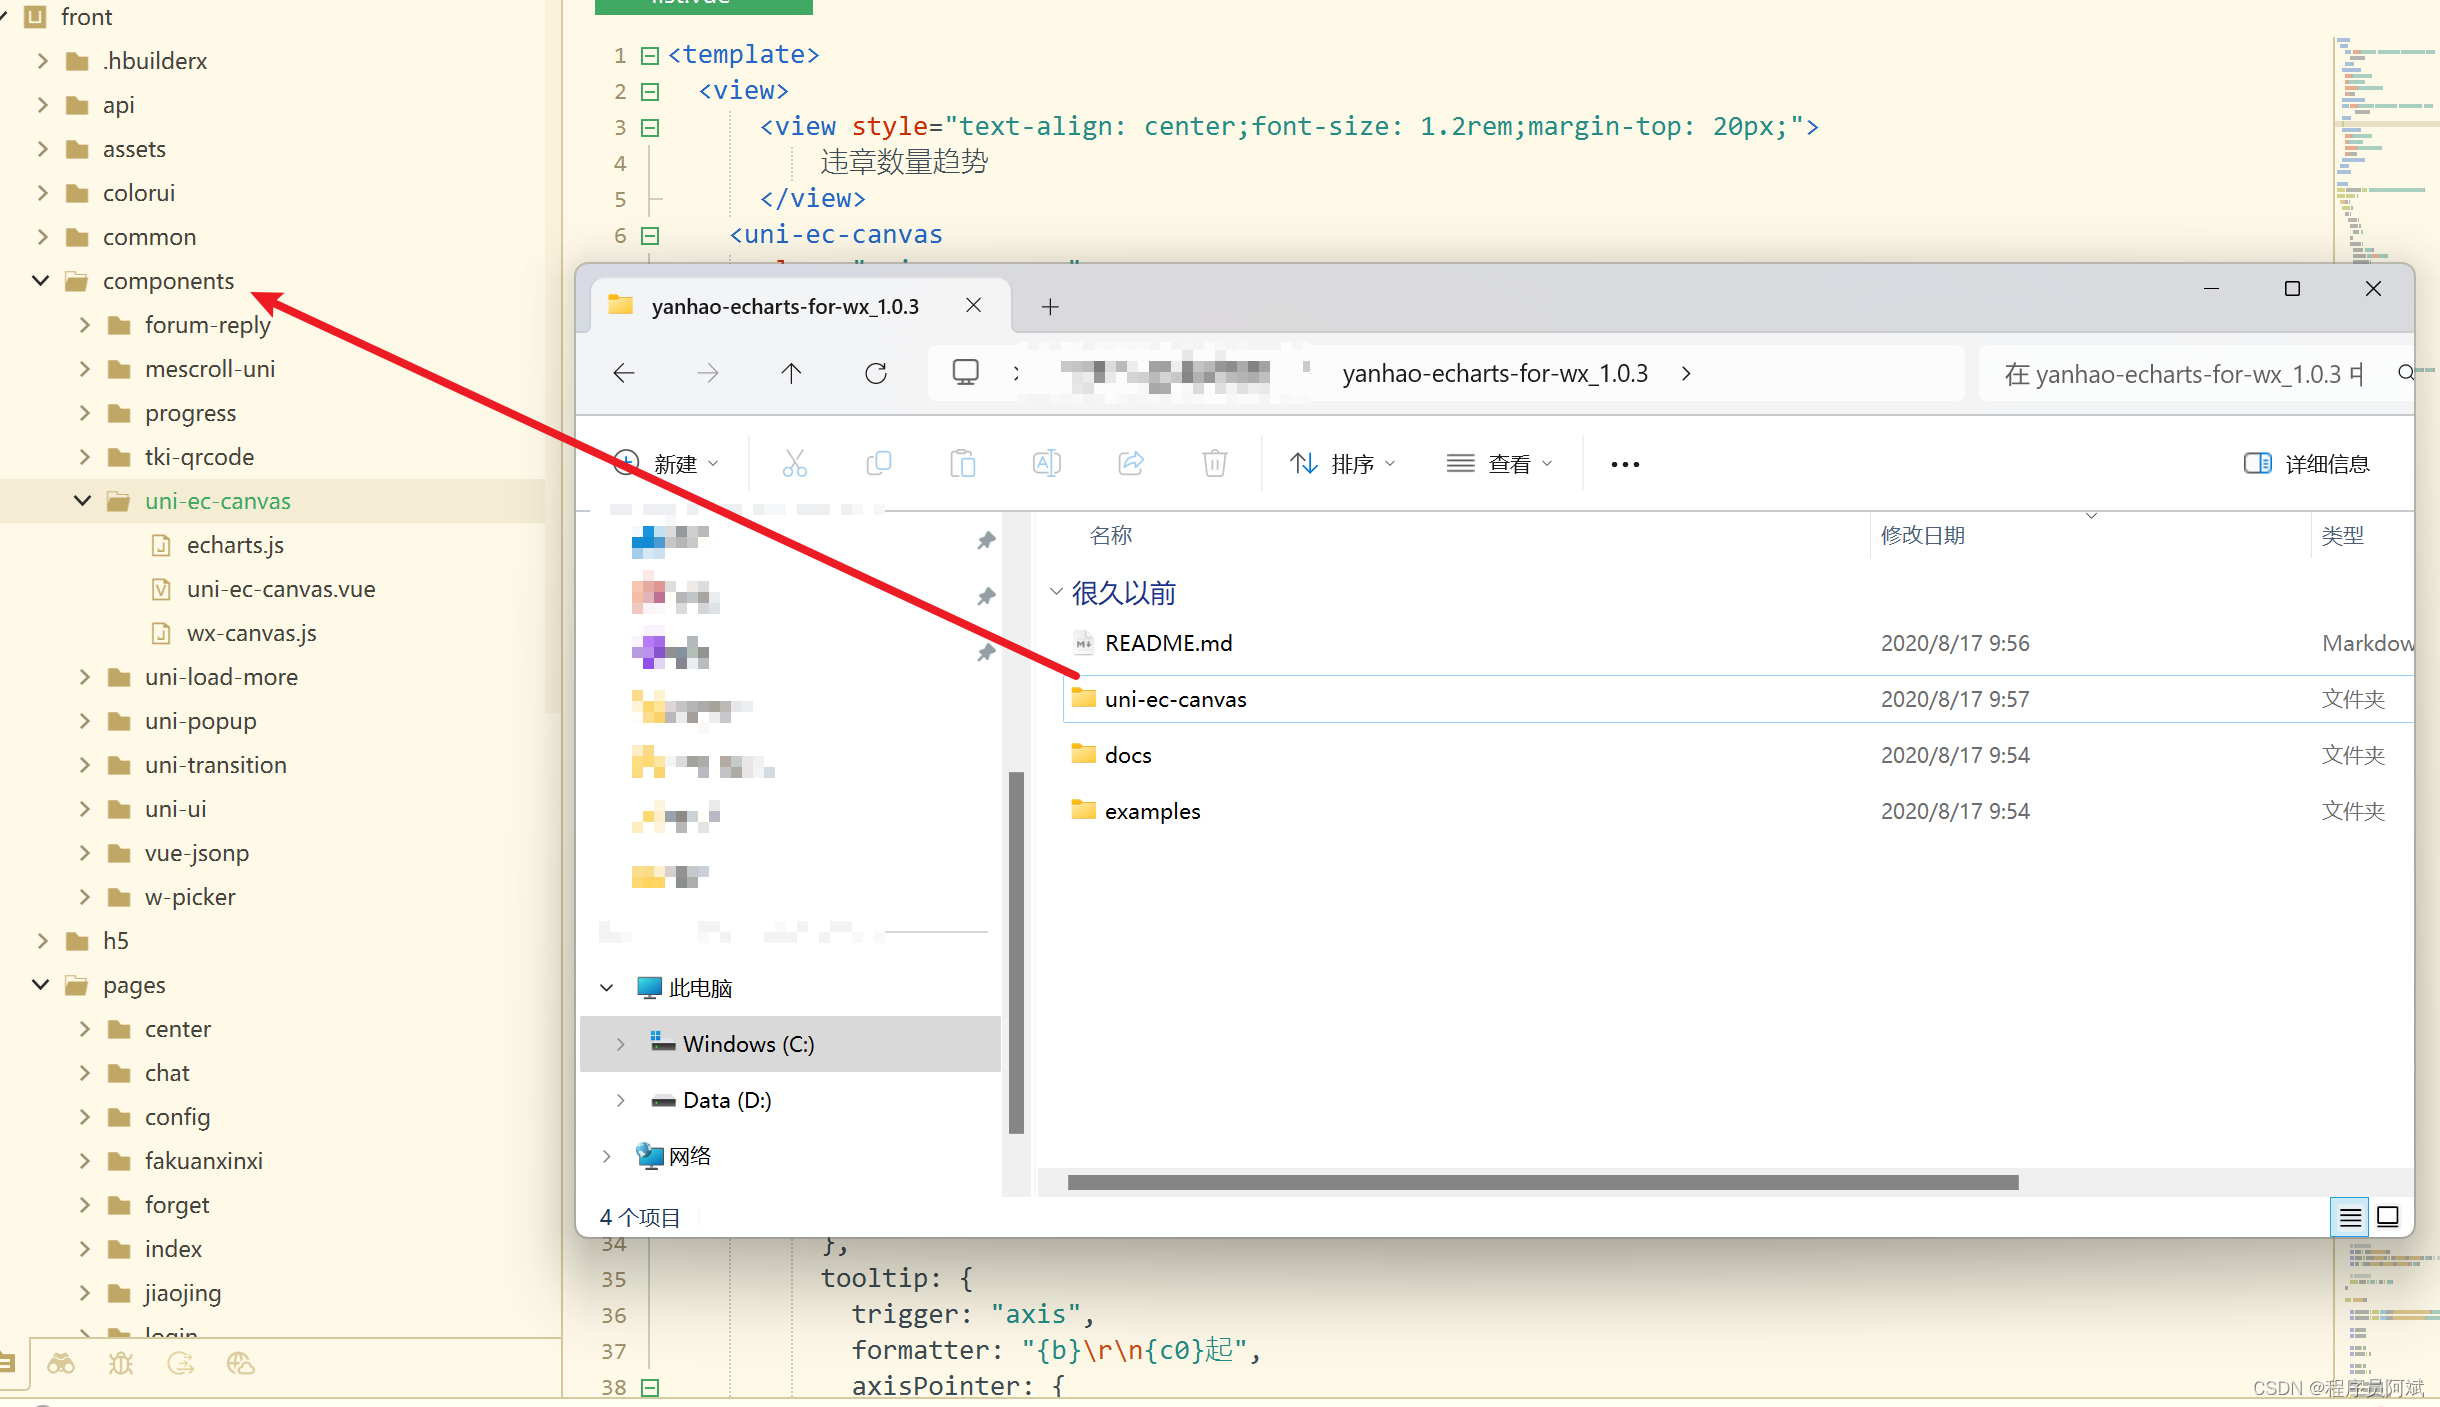
如图所示,我们只需要把yanhao-echarts-for-wx_1.0.3.zip解压,然后把uni-ec-canvas目录整个复制到你uniapp工程的components目录下。引入正确的目录层级如上图所示。
使用echarts组件
完成上述引入操作后我们就可以在我们的程序中使用echarts了。下载的插件压缩包yanhao-echarts-for-wx_1.0.3下也有示例程序在examples下。这里给出multi-charts.vue示例代码:
<template>
  <view>
    <uni-ec-canvas
      class="uni-ec-canvas"
      id="line-chart"
      canvas-id="multi-charts-line"
      :ec="ec"
    ></uni-ec-canvas>

    <uni-ec-canvas
      class="uni-ec-canvas"
      id="pie-chart"
      canvas-id="multi-charts-pie"
      :ec="ec2"
    ></uni-ec-canvas>
  </view>
</template>

<script>
import uniEcCanvas from "@/components/uni-ec-canvas/uni-ec-canvas";
export default {
  data() {
    return {
      ec: {
        option: {
          title: {
            text: ""
          },
          tooltip: {
            trigger: "axis",
            formatter: "{b}\r\n{c0}人",
            axisPointer: {
              type: "line",
              axis: "x",
              label: {
                backgroundColor: "#000000"
              }
            }
          },
          grid: {
            left: "6%",
            right: "6%",
            top: "6%",
            bottom: "6%",
            containLabel: true
          },
          xAxis: {
            type: "category",
            boundaryGap: false,
            data: ["2-12", "2-14", "2-16", "2-18", "2-20", "2-22", "2-24"],
            axisLine: {
              // y轴
              show: false
            },
            axisTick: {
              // y轴刻度线
              show: false
            },
            splitLine: {
              // 网格线
              show: false
            }
          },
          yAxis: {
            type: "value",
            axisLine: {
              // y轴
              show: false
            },
            axisTick: {
              // y轴刻度线
              show: false
            },
            splitLine: {
              // 网格线
              show: false
            }
          },
          series: [
            {
              name: "浏览量",
              type: "line",
              smooth: true,
              areaStyle: {
                color: {
                  type: "linear",
                  x: 0,
                  y: 0,
                  x2: 0,
                  y2: 1,
                  colorStops: [
                    {
                      offset: 0,
                      color: "#E50113" // 0% 处的颜色
                    },
                    {
                      offset: 1,
                      color: "#fff" // 100% 处的颜色
                    }
                  ],
                  global: false // 缺省为 false
                }
              },
              lineStyle: {
                color: "#EF5959"
              },
              data: [120, 132, 101, 134, 90, 230, 210]
            }
          ]
        }
      },
      ec2: {
        option: {
          title: {
            text: "7,5950",
            left: "center",
            top: "40%",
            subtext: "客户总数",
            subtextStyle: {
              color: "#959595",
              fontSize: 12,
              align: "center"
            },
            textStyle: {
              color: "#19193E",
              fontSize: 23,
              align: "center"
            }
          },
          series: [
            {
              name: "访问来源",
              type: "pie",
              radius: ["40%", "60%"],
              label: {
                position: "outside",
                color: "#19193E",
                normal: {
                  show: false
                },
                emphasis: {
                  show: true
                },
                fontSize: 10
              },
              labelLine: {
                normal: {
                  show: false
                },
                emphasis: {
                  show: true
                }
              },
              data: [
                {
                  value: 3321,
                  name: "直销中心",
                  itemStyle: {
                    normal: { color: "#EF5959" },
                    emphasis: { color: "#EF5959" }
                  }
                },
                {
                  value: 1148,
                  name: "手动录入",
                  itemStyle: {
                    normal: { color: "#ffa974" },
                    emphasis: { color: "#ffa974" }
                  }
                },
                {
                  value: 2532,
                  name: "线上访客",
                  itemStyle: {
                    normal: { color: "#ffc68a" },
                    emphasis: { color: "#ffc68a" }
                  }
                },
                {
                  value: 1148,
                  name: "线下拓客",
                  itemStyle: { color: "#F0DD93" }
                },
                {
                  value: 1148,
                  name: "名片海报",
                  itemStyle: { color: "#E7CB84" }
                },
                {
                  value: 1148,
                  name: "自然来访",
                  itemStyle: { color: "#7EBD95" }
                },
                { value: 1148, name: "分享家", itemStyle: { color: "#687793" } }
              ]
            }
          ]
        }
      }
    };
  },
  onReady() {
    setTimeout(() => {
      this.ec.option.series[0].data = [1, 2, 3, 4, 5, 6, 7];
      console.log("折线图数据改变啦");
    }, 1000);
    setTimeout(() => {
      //数组内的数据要$set哦
      this.ec2.option.series[0].data[0].value = 0;
      console.log("折线图数据改变啦");
    }, 2000);
  },
  components: {
    uniEcCanvas
  }
};
</script>

<style scoped>
.uni-ec-canvas {
  width: 750upx;
  height: 750upx;
  display: block;
}
</style>
添加完上面示例代码,再设置好工程路由之后就可以看到小程序图表渲染效果了。
页面效果
页面成功渲染了一个折线图和饼图:
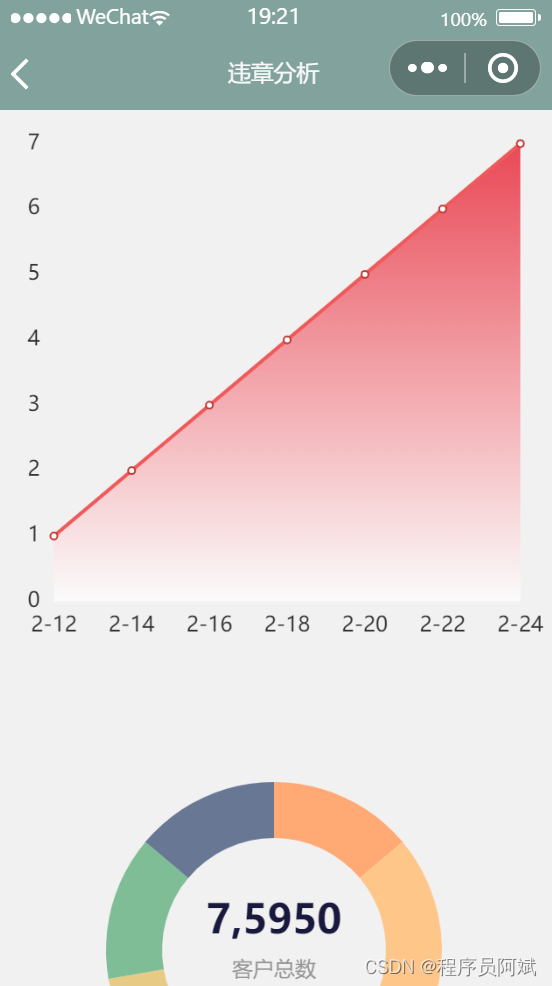
到此我们就成功引入echarts!
传送门
- uniapp插件市场:https://ext.dcloud.net.cn/
- echarts-wx-uniapp开源仓库地址:https://github.com/yah0130/echarts-wx-uniapp/


 741
741


 到【灌水乐园】发言


