prometheus获取kubelet接口监控数据

Kubernetes监控:配置Prometheus获取kubelet和cadvisor数据
本文详细介绍了如何在k8s集群内或外部署Prometheus以从kubelet获取监控数据,包括不同部署方式下的配置步骤,以及使用Grafana进行资源监控的注意事项。

一、前言

    k8s集群的kubelet服务内部有自带的cadvisor服务用于收集k8s集群的监控数据,所以可以通过调用kubelet的接口就能获取pod的资源监控数据,在新版本的k8s中,kubelet的监控数据获取端口为10250端口,老版本的是10255端口

二、配置prometheus获取监控数据

以下分为两种情况,一种是在k8s集群内部署的prometheus,一种是在k8s集群外部署的prometheus

以下是k8s集群外部署的prometheus配置

编辑Prometheus配置文件

vi /opt/prometheus/prometheus/prometheus.yml

scrape_configs:         #在该配置项下写入以下内容
  - job_name: k8s-cadvisor
    honor_timestamps: true
    metrics_path: /metrics/cadvisor
    scheme: https
    kubernetes_sd_configs:  # kubernetes 自动发现
    - api_server: https://10.1.60.119:6443  # apiserver 地址
      role: node   # node 类型的自动发现
      bearer_token_file: ./k8s.token
      tls_config:
        ca_file: ./ca.crt
        insecure_skip_verify: true
    bearer_token_file: ./k8s.token
    tls_config:
      ca_file: ./ca.crt
      insecure_skip_verify: true
    relabel_configs:
      - action: labelmap
        regex: __meta_kubernetes_node_label_(.+)
    metric_relabel_configs:
      - source_labels: [instance]
        separator: ;
        regex: (.+)
        target_label: node
        replacement: $1
        action: replace

以上关于token和ca证书的获取可以参考:k8s集群授权prometheus(集群外部署)_Apex Predator的博客-优快云博客 

token是创建一个名为k8s.token的文件,把k8s集群获取到的token放进去即可,ca证书就直接拷贝过来 

重启prometheus服务

systemctl restart prometheus

查看Prometheus是否获取到kubelet接口数据

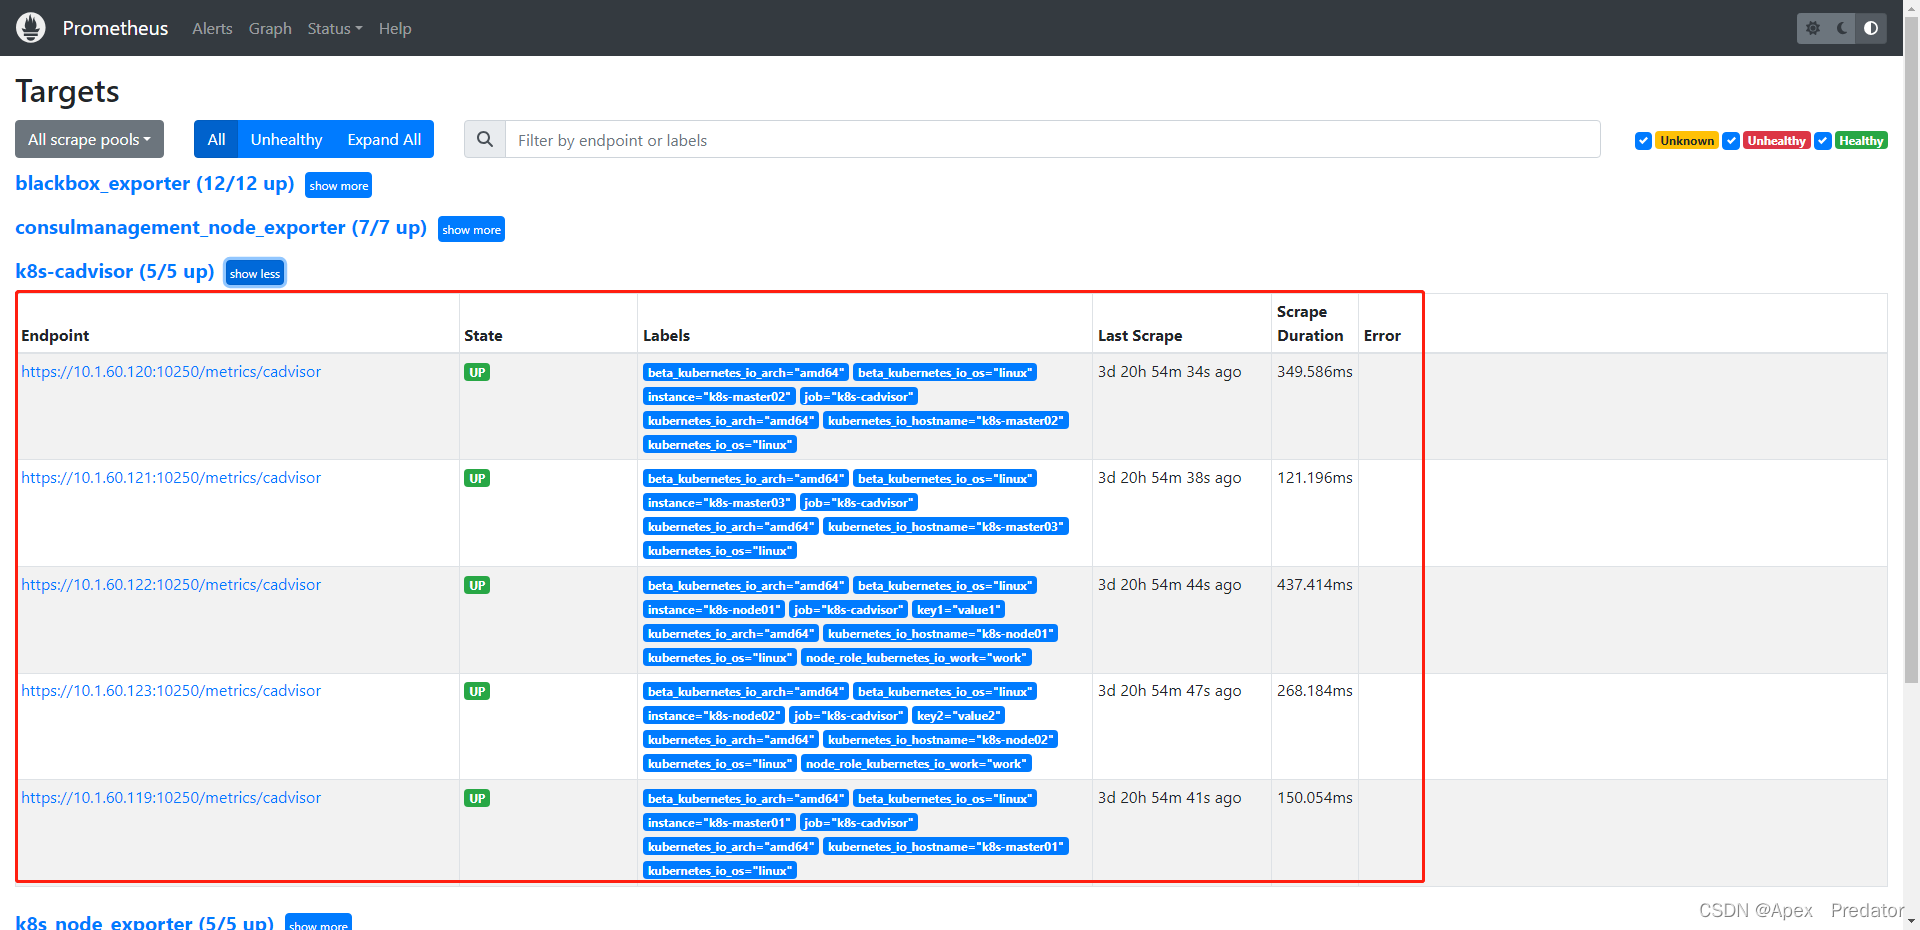
以下是k8s集群内部署的prometheus配置

vi /opt/prometheus/prometheus/prometheus.yml

scrape_configs:         #在该配置项下写入以下内容
  - job_name: 'k8s-kubelet'
    scheme: https
    tls_config:
      ca_file: /var/run/secrets/kubernetes.io/serviceaccount/ca.crt
    bearer_token_file: /var/run/secrets/kubernetes.io/serviceaccount/token
    kubernetes_sd_configs:
    - role: node
    relabel_configs:
    - target_label: __address__
      replacement: kubernetes.default.svc:443
    - source_labels: [__meta_kubernetes_node_name]
      regex: (.+)
      target_label: __metrics_path__
      replacement: /api/v1/nodes/${1}/proxy/metrics

  - job_name: 'k8s-cadvisor'    #配置cadvisor数据监控接口
    scheme: https
    tls_config:
      ca_file: /var/run/secrets/kubernetes.io/serviceaccount/ca.crt  #配置证书,该路径为prometheus pod内部的路径
      insecure_skip_verify: true    #必须加入此项配置,不然访问接口会报错
    bearer_token_file: /var/run/secrets/kubernetes.io/serviceaccount/token  #配置token,该路径为prometheus pod内部的路径
    kubernetes_sd_configs:
    - role: node
    relabel_configs:
    - target_label: __address__
      replacement: kubernetes.default.svc:443
    - source_labels: [__meta_kubernetes_node_name]
      regex: (.+)
      target_label: __metrics_path__
      replacement: /api/v1/nodes/${1}/proxy/metrics/cadvisor
    metric_relabel_configs:
    - source_labels: [instance]
      separator: ;
      regex: (.+)
      target_label: node
      replacement: $1
      action: replace

  - job_name: kube-state-metrics    #配置kube-state-metrics数据监控接口
    kubernetes_sd_configs:
    - role: endpoints
      namespaces:
        names:
        - ops-monit
    relabel_configs:
    - source_labels: [__meta_kubernetes_service_label_app_kubernetes_io_name]
      regex: kube-state-metrics
      replacement: $1
      action: keep

重启prometheus服务

systemctl restart prometheus

以上就是两种不同的Prometheus部署方式去获取kubelet监控数据的配置方法

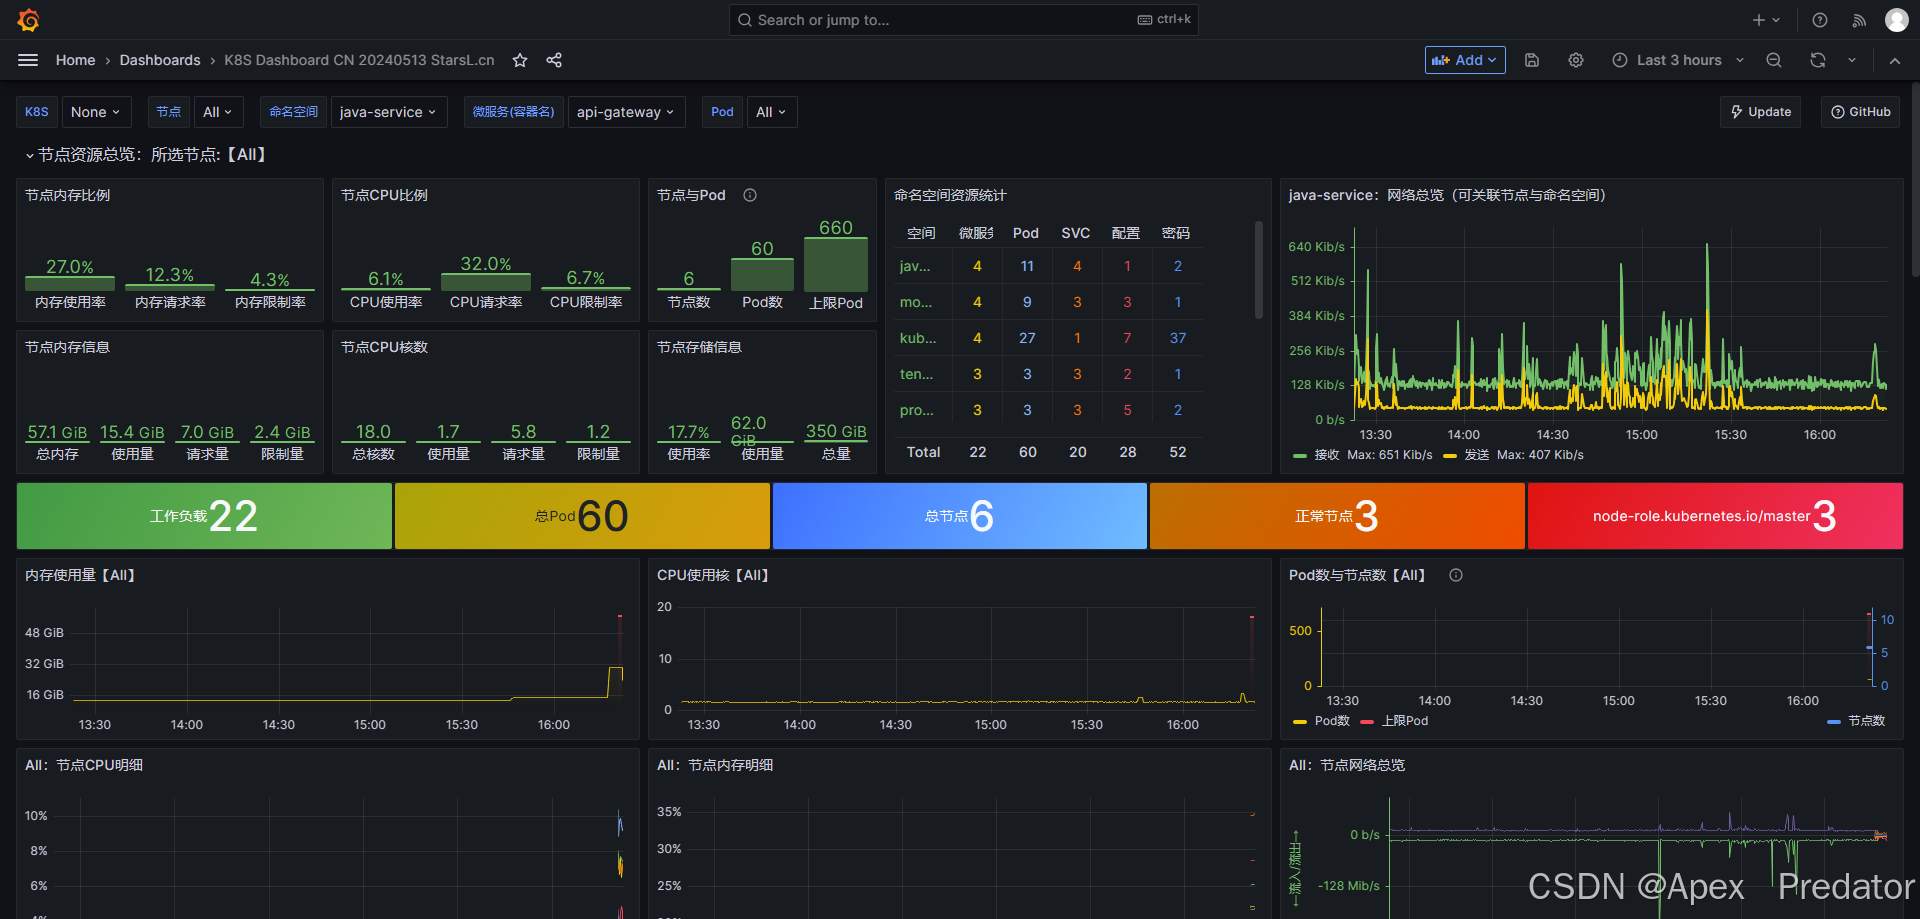
关于granfana使用的资源监控模板则是使用:

K8S Dashboard CN 20240513 StarsL.cn | Grafana Labs

需要配合kube-state-metrics监控一起使用,但是使用该模板在1.24本版以上的k8s中都会出现数据缺失

[move_allocation] can't move 0, from {node-89}{s5UbNjk3S7qGAo5SHsp1fg}{-snYJlqwQbyIpsD7JTT6qA}{192.168.10.89}{192.168.10.89:9300}{cdfhilmrstw}{ml.machine_memory=33568047104, xpack.installed=true, transform.node=true, ml.max_open_jobs=512, ml.max_jvm_size=1132462080}, to {node-92}{-gRlwVTPSaKHSfU3ikwj2w}{mbSK3mB1TXKN2rSFgB0UUw}{192.168.10.92}{192.168.10.92:9300}{cdfhilmrstw}{ml.machine_memory=33568063488, ml.max_open_jobs=512, xpack.installed=true, ml.max_jvm_size=1132462080, transform.node=true}, since its not allowed, reason: [YES(shard has no previous failures)][YES(shard is primary and can be allocated)][YES(explicitly ignoring any disabling of allocation due to manual allocation commands via the reroute API)][YES(can relocate primary shard from a node with version [7.17.3] to a node with equal-or-newer version [7.17.3])][YES(no snapshots are currently running)][YES(ignored as shard is not being recovered from a snapshot)][YES(this node is not currently shutting down)][YES(neither the source nor target node are part of an ongoing node replacement (no replacements))][YES(node passes include/exclude/require filters)][NO(a copy of this shard is already allocated to this node [[citms-mcmmessage-2025.01][0], node[-gRlwVTPSaKHSfU3ikwj2w], [R], s[STARTED], a[id=cDtFDnQRSummQox2Sr2N8g]])][YES(enough disk for shard on node, free: [120.2gb], shard size: [1.6gb], free after allocating shard: [118.6gb])][YES(below shard recovery limit of outgoing: [0 < 2] incoming: [0 < 2])][YES(total shard limits are disabled: [index: -1, cluster: -1] <= 0)][YES(allocation awareness is not enabled, set cluster setting [cluster.routing.allocation.awareness.attributes] to enable it)][YES(index has a preference for tiers [data_content] and node has tier [data_content])][YES(shard is not a follower and is not under the purview of this decider)][YES(decider only applicable for indices backed by searchable snapshots)][YES(this decider only applies to indices backed by searchable snapshots)][YES(decider only applicable for indices backed by searchable snapshots)][YES(this node's data roles are not exactly [data_frozen] so it is not a dedicated frozen node)]
最新发布
07-16
### 问题分析 在 Elasticsearch 中,`move_allocation can't move shard reason: a copy of this shard is already allocated to this node` 表示尝试将某个分片从一个节点移动到另一个节点时失败,原因是目标节点已经存在该分片的副本。这一限制是 Elasticsearch 的分配机制之一,确保同一分片的多个副本不会被分配到同一个节点上,以避免单点故障导致数据丢失。 Elasticsearch 在执行 `shard allocation`、`shard move` 或 `shard rebalance` 操作时,会根据一系列决策规则(Decision)判断是否允许分片迁移或重新分配。其中一项关键规则就是防止同一节点持有同一分片的多个副本[^1]。 --- ### 解决方案 #### 1. **确认当前分片分布** 首先应使用 `_cat/shards` API 查看当前索引的分片分布情况: ```bash curl -XGET 'http://localhost:9200/_cat/shards/logs-000001?v' ``` 通过该命令可以确认哪些节点已经持有主分片和副本分片,从而判断是否存在重复分配的情况。 #### 2. **检查节点角色与副本设置** 若集群中节点数量不足以容纳所有副本,也可能导致无法正确分配分片。例如,在单节点环境中创建具有多个副本的索引会导致部分副本无法分配。可以通过调整副本数来解决此问题: ```json PUT /logs-000001/_settings { "number_of_replicas": 0 } ``` 此操作可临时关闭副本分配,避免因节点数量不足而导致的冲突[^4]。 #### 3. **使用 `_cluster/reroute` API 手动指定分片移动** 如果确认目标节点未持有该分片的副本但仍然出现错误,可能是缓存或状态同步问题。此时可通过 `_cluster/reroute` API 显式指定移动操作,并添加 `"allow_primary": true` 参数(仅适用于主分片移动): ```json POST /_cluster/reroute { "commands": [ { "move": { "index": "logs-000001", "shard": 0, "from_node": "nodeA", "to_node": "nodeB" } } ] } ``` 注意:该操作仅在目标节点未实际持有该分片副本的前提下有效。若节点确实已持有副本,则必须先删除旧副本再进行移动。 #### 4. **清理无效副本** 若发现某些节点持有孤立的副本(如节点重启后残留的分片数据),可使用 `_shard_stores` API 检查并手动删除无效分片数据: ```bash GET /_shard_stores ``` 根据返回信息识别无效副本路径,并通过文件系统删除对应目录,释放空间并清除冲突来源[^3]。 --- ### 注意事项 - 在执行任何手动分片操作前,建议先查看集群健康状态和分片分配策略,确保理解当前拓扑结构。 - 避免在同一节点上运行多个 Elasticsearch 实例,除非启用 `cluster.routing.allocation.same_shard.host: true`,否则可能导致误判副本重复分配问题[^3]。 ---
评论
成就一亿技术人!
拼手气红包6.0元
还能输入1000个字符
 
红包 添加红包
表情包 插入表情
 条评论被折叠 查看
添加红包

请填写红包祝福语或标题

红包个数最小为10个

红包金额最低5元

当前余额3.43前往充值 >
需支付:10.00
成就一亿技术人!
领取后你会自动成为博主和红包主的粉丝 规则
hope_wisdom
发出的红包
实付
使用余额支付
点击重新获取
扫码支付
钱包余额 0

抵扣说明:

1.余额是钱包充值的虚拟货币,按照1:1的比例进行支付金额的抵扣。
2.余额无法直接购买下载,可以购买VIP、付费专栏及课程。

余额充值