


1、安装Prometheus
(1)、在Prometheus官网Download | Prometheus下载适用于鲲鹏麒麟的安装包,操作系统选择Linux,架构选择arm64,也可直接使用如下地址下载
https://github.com/prometheus/prometheus/releases/download/v2.51.2/prometheus-2.51.2.linux-arm64.tar.gz(2)、Prometheus安装路径规划在/data/app/,将下载的prometheus-2.51.2.linux-arm64.tar.gz文件上传到/data/app/,执行解压
tar -zxvf ./prometheus-2.51.2.linux-arm64.tar.gz解压后可将prometheus-2.51.2.linux-arm64目录名修改为prometheus
(3)、进入解压后的目录,修改配置文件prometheus.yml
# my global config
global:
  scrape_interval: 15s # Set the scrape interval to every 15 seconds. Default is every 1 minute.
  evaluation_interval: 15s # Evaluate rules every 15 seconds. The default is every 1 minute.
  # scrape_timeout is set to the global default (10s).

# Alertmanager configuration
alerting:
  alertmanagers:
    - static_configs:
        - targets:
          # - alertmanager:9093

# Load rules once and periodically evaluate them according to the global 'evaluation_interval'.
rule_files:
  # - "first_rules.yml"
  # - "second_rules.yml"

scrape_configs:
  - job_name: "prometheus"
    static_configs:
      - targets: ["localhost:9080"]

  - job_name: "node_exporter"
    static_configs:
      - targets: ["10.16.3.1:1801"]
      - targets: ["10.16.3.2:1801"]
      - targets: ["10.16.3.3:1801"]
      - targets: ["10.16.3.4:1801"]
      - targets: ["10.16.3.5:1801"]
      - targets: ["10.16.3.6:1801"]
      - targets: ["10.16.3.7:1801"]
      - targets: ["10.16.3.8:1801"]
      - targets: ["10.16.3.9:1801"]
      - targets: ["10.16.3.10:1801"]
      - targets: ["10.16.3.11:1801"]
      - targets: ["10.16.3.12:1801"]
Prometheus服务端默认端口为9090,这里使用9080,因此job_name为prometheus的targets修改为localhost:9080,job_name为node_exporter为需要监听的节点(Prometheus为主动拉取各个节点的监控数据),这里需要和“3、配置node exporter”前后呼应,注意修改配置后,Prometheus需要重新启动一下。
(4)、启动Prometheus,执行
nohup /data/app/prometheus/prometheus --web.listen-address=:9080 --config.file="/data/app/prometheus/prometheus.yml" &--web.listen-address=:9080为访问端口
(5)、打开浏览器,这是就可以访问了http://10.16.39.1:9080,可以选择导航栏Status菜单Targets查看监听的各个节点信息。
2、安装Grafana
(1)在Grafana官网Grafana: The open observability platform | Grafana Labs下载,同样注意选择相应的版本,也可以使用如下地址直接下载
https://dl.grafana.com/oss/release/grafana-8.4.7.linux-arm64.tar.gz
https://dl.grafana.com/oss/release/grafana-9.4.7.linux-arm64.tar.gz
这里使用
tar -zxvf ./grafana-8.4.7.linux-arm64.tar.gz
mv grafana-8.4.7.linux-arm64 grafana
这个版本,同样使用上面的方法进行解压和修改目录名
(2)进入Grafana目录下的bin目录,执行启动命令
./grafana-server start &(3)打开浏览器,这是就可以访问了http://10.16.39.1:3000了。
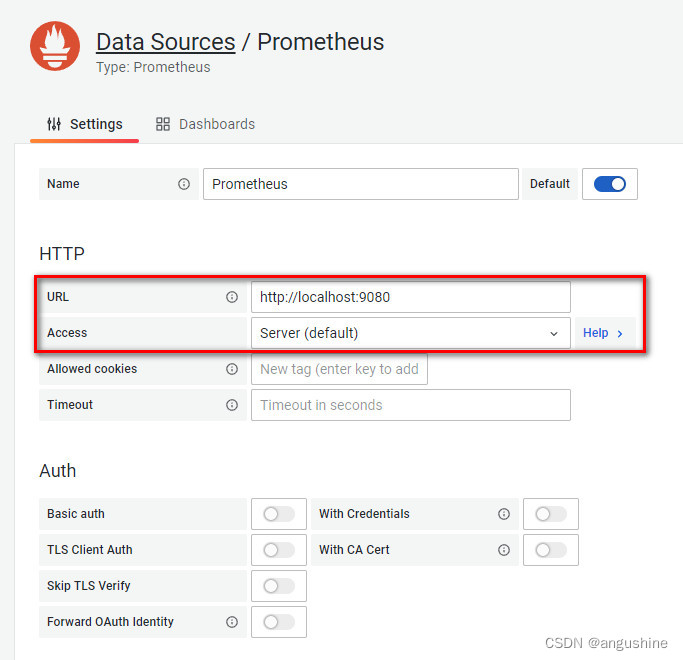
(4)配置数据源,在设置中添加数据源,如下图所示
3、配置node exporter
(1)在Prometheus下载页面下载对应的exporter,这里因为要监控服务器,只用node_exporter,如果要监听MySQL,可以下载mysqld_exporter,以此类推,node_exporter下载地址如下
https://github.com/prometheus/node_exporter/releases/download/v1.8.0/node_exporter-1.8.0.linux-arm64.tar.gz(2)解压下载的文件并改名
tar -zxvf ./node_exporter-1.8.0.linux-arm64.tar.gz
mv node_exporter-1.8.0.linux-arm64 node_exporter
(3)启动
nohup ./node_exporter --web.listen-address=:1801 >start.log &这时在http://10.16.3.1:1801就可以访问了,访问http://10.16.3.1:1801/metrics就可以查看监控的节点信息
(4)这时就可以在http://10.16.3.1:9080网站Status->Targets页面看到对应节点的状态信息。
(5)如果防火墙开启了,还需要增加相应的访问端口
# 增加Prometheus访问端口
firewall-cmd --zone=public --add-port=9080/tcp --permanent
# 增加Grafana访问端口
firewall-cmd --zone=public --add-port=3000/tcp --permanent
# 增加node exporter访问端口
firewall-cmd --zone=public --add-port=1801/tcp --permanent
# 使配置生效
firewall-cmd --reload
(6)增加开机启动
使用命令:vi /etc/rc.local,在文件尾部追加
nohup /data/public/node_exporter/node_exporter --web.listen-address=:1801 > /data/public/node_exporter/start.log &4、Grafana导入监控配置
{
"__inputs": [
{
"name": "DS_TEST-PROMETHEUS",
"label": "Prometheus",
"description": "",
"type": "datasource",
"pluginId": "prometheus",
"pluginName": "Prometheus"
}
],
"__elements": [],
"__requires": [
{
"type": "panel",
"id": "bargauge",
"name": "Bar gauge",
"version": ""
},
{
"type": "grafana",
"id": "grafana",
"name": "Grafana",
"version": "8.3.6"
},
{
"type": "panel",
"id": "graph",
"name": "Graph (old)",
"version": ""
},
{
"type": "datasource",
"id": "prometheus",
"name": "Prometheus",
"version": "1.0.0"
},
{
"type": "panel",
"id": "stat",
"name": "Stat",
"version": ""
},
{
"type": "panel",
"id": "table",
"name": "Table",
"version": ""
}
],
"annotations": {
"list": [
{
"$$hashKey": "object:2875",
"builtIn": 1,
"datasource": "-- Grafana --",
"enable": true,
"hide": true,
"iconColor": "rgba(0, 211, 255, 1)",
"name": "Annotations & Alerts",
"target": {
"limit": 100,
"matchAny": false,
"tags": [],
"type": "dashboard"
},
"type": "dashboard"
}
]
},
"description": "基于ConsulManager采集的ECS,可匹配自动同步方式采集ECS信息字段的展示,优化重要指标展示。使用Grafana8新表格重建,新增健康评分概念,并新增了整体资源消耗信息的一些图表。包含整体资源展示与资源明细图表:CPU 内存 磁盘 IO 网络等监控指标。https://github.com/starsliao/ConsulManager",
"editable": true,
"fiscalYearStartMonth": 0,
"gnetId": 8919,
"graphTooltip": 0,
"id": null,
"iteration": 1649806176515,
"links": [
{
"$$hashKey": "object:2300",
"icon": "bolt",
"tags": [],
"targetBlank": true,
"title": "Update",
"tooltip": "更新当前仪表板",
"type": "link",
"url": "https://grafana.com/dashboards/8919"
},
{
"$$hashKey": "object:2301",
"icon": "question",
"tags": [],
"targetBlank": true,
"title": "GitHub",
"tooltip": "查看更多仪表板",
"type": "link",
"url": "https://github.com/starsliao/ConsulManager"
},
{
"$$hashKey": "object:2302",
"asDropdown": true,
"icon": "external link",
"tags": [],
"targetBlank": true,
"title": "",
"type": "dashboards"
}
],
"liveNow": false,
"panels": [
{
"collapsed": false,
"datasource": {
"type": "prometheus",
"uid": "${DS_TEST-PROMETHEUS}"
},
"gridPos": {
"h": 1,
"w": 24,
"x": 0,
"y": 0
},
"id": 187,
"panels": [],
"title": "资源总览:当前选中主机:$show_name,实例:$instance",
"type": "row"
},
{
"description": "分区使用率、磁盘读取、磁盘写入、下载带宽、上传带宽,如果有多个网卡或者多个分区,是采集的使用率最高的网卡或者分区的数值。\n\n连接数:CurrEstab - 当前状态为 ESTABLISHED 或 CLOSE-WAIT 的 TCP 连接数。\n\n健康值是一个新增的指标,根据CPU,内存,IO计算出来的一个值,低于90分说明系统的资源使用情况需要注意了,这是一个正在测试的指标,参数可能需要根据实际情况再优化。",
"fieldConfig": {
"defaults": {
"color": {
"mode": "thresholds"
},
"custom": {
"align": "center",
"displayMode": "auto",
"filterable": false
},
"decimals": 1,
"mappings": [],
"max": 100,
"thresholds": {
"mode": "absolute",
"steps": [
{
"color": "green",
"value": null
}
]
},
"unit": "none"
},
"overrides": [
{
"matcher": {
"id": "byName",
"options": "内存"
},
"properties": [
{
"id": "unit",
"value": "bytes"
},
{
"id": "decimals"
},
{
"id": "custom.width",
"value": 67
},
{
"id": "color",
"value": {
"fixedColor": "blue",
"mode": "fixed"
}
},
{
"id": "custom.displayMode",
"value": "color-text"
},
{
"id": "decimals",
"value": 0
}
]
},
{
"matcher": {
"id": "byName",
"options": "启动(天)"
},
"properties": [
{
"id": "unit",
"value": "none"
},
{
"id": "custom.width",
"value": 40
},
{
"id": "decimals"
}
]
},
{
"matcher": {
"id": "byName",
"options": "磁盘读取*"
},
"properties": [
{
"id": "unit",
"value": "binBps"
},
{
"id": "custom.displayMode",
"value": "color-background"
},
{
"id": "thresholds",
"value": {
"mode": "absolute",
"steps": [
{
"color": "rgba(50, 172, 45, 0.97)",
"value": null
},
{
"color": "rgba(237, 129, 40, 0.89)",
"value": 10485760
},
{
"color": "rgba(245, 54, 54, 0.9)",
"value": 20485760
}
]
}
},
{
"id": "custom.width",
"value": 78
}
]
},
{
"matcher": {
"id": "byName",
"options": "磁盘写入*"
},
"properties": [
{
"id": "unit",
"value": "binBps"
},
{
"id": "custom.displayMode",
"value": "color-background"
},
{
"id": "thresholds",
"value": {
"mode": "absolute",
"steps": [
{
"color": "rgba(50, 172, 45, 0.97)",
"value": null
},
{
"color": "rgba(237, 129, 40, 0.89)",
"value": 10485760
},
{
"color": "rgba(245, 54, 54, 0.9)",
"value": 20485760
}
]
}
},
{
"id": "custom.width",
"value": 81
}
]
},
{
"matcher": {
"id": "byName",
"options": "下载带宽*"
},
"properties": [
{
"id": "unit",
"value": "binbps"
},
{
"id": "custom.displayMode",
"value": "color-background"
},
{
"id": "thresholds",
"value": {
"mode": "absolute",
"steps": [
{
"color": "rgba(50, 172, 45, 0.97)",
"value": null
},
{
"color": "rgba(237, 129, 40, 0.89)",
"value": 30485760
},
{
"color": "rgba(245, 54, 54, 0.9)",
"value": 104857600
}
]
}
},
{
"id": "custom.width",
"value": 81
},
{
"id": "decimals"
}
]
},
{
"matcher": {
"id": "byName",
"options": "上传带宽*"
},
"properties": [
{
"id": "unit",
"value": "binbps"
},
{
"id": "custom.displayMode",
"value": "color-background"
},
{
"id": "thresholds",
"value": {
"mode": "absolute",
"steps": [
{
"color": "rgba(50, 172, 45, 0.97)",
"value": null
},
{
"color": "rgba(237, 129, 40, 0.89)",
"value": 30485760
},
{
"color": "rgba(245, 54, 54, 0.9)",
"value": 104857600
}
]
}
},
{
"id": "custom.width",
"value": 85
},
{
"id": "decimals"
}
]
},
{
"matcher": {
"id": "byName",
"options": "负载"
},
"properties": [
{
"id": "decimals",
"value": 2
},
{
"id": "custom.width",
"value": 50
}
]
},
{
"matcher": {
"id": "byName",
"options": "连接数"
},
"properties": [
{
"id": "custom.displayMode",
"value": "color-background"
},
{
"id": "thresholds",
"value": {
"mode": "absolute",
"steps": [
{
"color": "rgba(50, 172, 45, 0.97)",
"value": null
},
{
"color": "rgba(237, 129, 40, 0.89)",
"value": 1000
},
{
"color": "rgba(245, 54, 54, 0.9)",
"value": 1500
}
]
}
},
{
"id": "custom.width",
"value": 54
},
{
"id": "decimals"
}
]
},
{
"matcher": {
"id": "byName",
"options": "TCP_tw"
},
"properties": [
{
"id": "custom.displayMode",
"value": "color-background"
},
{
"id": "thresholds",
"value": {
"mode": "absolute",
"steps": [
{
"color": "rgba(50, 172, 45, 0.97)",
"value": null
},
{
"color": "rgba(237, 129, 40, 0.89)",
"value": 5000
},
{
"color": "rgba(245, 54, 54, 0.9)",
"value": 20000
}
]
}
},
{
"id": "custom.width",
"value": 63
},
{
"id": "decimals"
}
]
},
{
"matcher": {
"id": "byName",
"options": "CPU"
},
"properties": [
{
"id": "custom.width",
"value": 44
},
{
"id": "decimals",
"value": 0
},
{
"id": "custom.displayMode",
"value": "color-text"
},
{
"id": "color",
"value": {
"fixedColor": "blue",
"mode": "fixed"
}
}
]
},
{
"matcher": {
"id": "byName",
"options": "IP"
},
"properties": [
{
"id": "custom.width",
"value": 80
},
{
"id": "custom.filterable",
"value": true
},
{
"id": "mappings",
"value": [
{
"options": {
"pattern": "/(.*):.*/",
"result": {
"index": 0,
"text": "$1"
}
},
"type": "regex"
}
]
}
]
},
{
"matcher": {
"id": "byName",
"options": "名称"
},
"properties": [
{
"id": "custom.filterable",
"value": true
},
{
"id": "custom.width",
"value": 75
}
]
},
{
"matcher": {
"id": "byName",
"options": "健康值"
},
"properties": [
{
"id": "custom.width",
"value": 52
},
{
"id": "thresholds",
"value": {
"mode": "absolute",
"steps": [
{
"color": "red",
"value": null
},
{
"color": "orange",
"value": 80
},
{
"color": "green",
"value": 90
}
]
}
},
{
"id": "color",
"value": {
"mode": "thresholds"
}
},
{
"id": "custom.displayMode",
"value": "color-background"
}
]
},
{
"matcher": {
"id": "byRegexp",
"options": "/.*使用率.*/"
},
"properties": [
{
"id": "unit",
"value": "percent"
},
{
"id": "custom.displayMode",
"value": "gradient-gauge"
},
{
"id": "color",
"value": {
"mode": "continuous-GrYlRd"
}
},
{
"id": "custom.width",
"value": 100
}
]
},
{
"matcher": {
"id": "byName",
"options": "IOutil使用率*"
},
"properties": [
{
"id": "custom.width",
"value": 95
}
]
},
{
"matcher": {
"id": "byName",
"options": "分区使用率*"
},
"properties": [
{
"id": "custom.width",
"value": 96
}
]
},
{
"matcher": {
"id": "byName",
"options": "到期日"
},
"properties": [
{
"id": "custom.width",
"value": 86
}
]
},
{
"matcher": {
"id": "byName",
"options": "实例ID"
},
"properties": [
{
"id": "custom.width",
"value": 62
}
]
}
]
},
"gridPos": {
"h": 10,
"w": 24,
"x": 0,
"y": 1
},
"id": 198,
"options": {
"footer": {
"fields": [
"Value #B",
"Value #C",
"Value #L",
"Value #H",
"Value #I",
"Value #M",
"Value #N",
"Value #J",
"Value #K"
],
"reducer": [
"sum"
],
"show": false
},
"showHeader": true,
"sortBy": [
{
"desc": false,
"displayName": "健康值"
}
]
},
"pluginVersion": "8.3.6",
"targets": [
{
"datasource": {
"type": "prometheus",
"uid": "${DS_TEST-PROMETHEUS}"
},
"exemplar": false,
"expr": "node_uname_info{vendor=~\"$vendor\",account=~\"$account\",group=~\"$group\",name=~\"$name\",name=~\".*$sname.*\"} - 0",
"format": "table",
"hide": false,
"instant": true,
"interval": "",
"legendFormat": "主机名",
"refId": "A"
},
{
"datasource": {
"type": "prometheus",
"uid": "${DS_TEST-PROMETHEUS}"
},
"exemplar": false,
"expr": "sum(time() - node_boot_time_seconds{vendor=~\"$vendor\",account=~\"$account\",group=~\"$group\",name=~\"$name\",name=~\".*$sname.*\"})by(instance)/86400",
"format": "table",
"hide": false,
"instant": true,
"interval": "",
"legendFormat": "运行时间",
"refId": "D"
},
{
"datasource": {
"type": "prometheus",
"uid": "${DS_TEST-PROMETHEUS}"
},
"exemplar": false,
"expr": "node_memory_MemTotal_bytes{vendor=~\"$vendor\",account=~\"$account\",group=~\"$group\",name=~\"$name\",name=~\".*$sname.*\"} - 0",
"format": "table",
"hide": false,
"instant": true,
"interval": "",
"legendFormat": "总内存",
"refId": "B"
},
{
"datasource": {
"type": "prometheus",
"uid": "${DS_TEST-PROMETHEUS}"
},
"exemplar": false,
"expr": "count(node_cpu_seconds_total{vendor=~\"$vendor\",account=~\"$account\",group=~\"$group\",name=~\"$name\",mode='system',name=~\".*$sname.*\"}) by (instance)",
"format": "table",
"hide": false,
"instant": true,
"interval": "",
"legendFormat": "总核数",
"refId": "C"
},
{
"datasource": {
"type": "prometheus",
"uid": "${DS_TEST-PROMETHEUS}"
},
"exemplar": false,
"expr": "node_load5{vendor=~\"$vendor\",account=~\"$account\",group=~\"$group\",name=~\"$name\",name=~\".*$sname.*\"}",
"format": "table",
"instant": true,
"interval": "",
"legendFormat": "5分钟负载",
"refId": "L"
},
{
"datasource": {
"type": "prometheus",
"uid": "${DS_TEST-PROMETHEUS}"
},
"exemplar": false,
"expr": "(1 - avg(rate(node_cpu_seconds_total{vendor=~\"$vendor\",account=~\"$account\",group=~\"$group\",name=~\"$name\",mode=\"idle\",name=~\".*$sname.*\"}[$interval])) by (instance)) * 100",
"format": "table",
"hide": false,
"instant": true,
"interval": "",
"legendFormat": "CPU使用率",
"refId": "F"
},
{
"datasource": {
"type": "prometheus",
"uid": "${DS_TEST-PROMETHEUS}"
},
"exemplar": false,
"expr": "(1 - (node_memory_MemAvailable_bytes{vendor=~\"$vendor\",account=~\"$account\",group=~\"$group\",name=~\"$name\",name=~\".*$sname.*\"} / (node_memory_MemTotal_bytes{vendor=~\"$vendor\",account=~\"$account\",group=~\"$group\",name=~\"$name\",name=~\".*$sname.*\"})))* 100",
"format": "table",
"hide": false,
"instant": true,
"interval": "",
"legendFormat": "内存使用率",
"refId": "G"
},
{
"datasource": {
"type": "prometheus",
"uid": "${DS_TEST-PROMETHEUS}"
},
"exemplar": false,
"expr": "max((node_filesystem_size_bytes{vendor=~\"$vendor\",account=~\"$account\",group=~\"$group\",name=~\"$name\",name=~\".*$sname.*\",fstype=~\"ext.?|xfs\"}-node_filesystem_free_bytes{vendor=~\"$vendor\",account=~\"$account\",group=~\"$group\",name=~\"$name\",name=~\".*$sname.*\",fstype=~\"ext.?|xfs\"}) *100/(node_filesystem_avail_bytes {vendor=~\"$vendor\",account=~\"$account\",group=~\"$group\",name=~\"$name\",name=~\".*$sname.*\",fstype=~\"ext.?|xfs\"}+(node_filesystem_size_bytes{vendor=~\"$vendor\",account=~\"$account\",group=~\"$group\",name=~\"$name\",name=~\".*$sname.*\",fstype=~\"ext.?|xfs\"}-node_filesystem_free_bytes{vendor=~\"$vendor\",account=~\"$account\",group=~\"$group\",name=~\"$name\",name=~\".*$sname.*\",fstype=~\"ext.?|xfs\"})))by(instance)",
"format": "table",
"hide": false,
"instant": true,
"interval": "",
"legendFormat": "分区使用率",
"refId": "E"
},
{
"datasource": {
"type": "prometheus",
"uid": "${DS_TEST-PROMETHEUS}"
},
"exemplar": false,
"expr": "max(rate(node_disk_read_bytes_total{vendor=~\"$vendor\",account=~\"$account\",group=~\"$group\",name=~\"$name\",name=~\".*$sname.*\"}[$interval])) by (instance)",
"format": "table",
"hide": false,
"instant": true,
"interval": "",
"legendFormat": "最大读取",
"refId": "H"
},
 最低0.47元/天 解锁文章


 3152
3152


 到【灌水乐园】发言


