


https://www.sciencedirect.com/science/article/pii/S0038071723003681#bib32
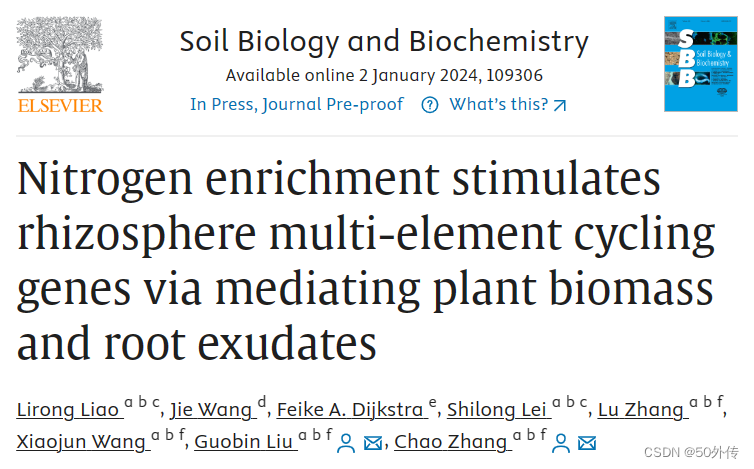
全球氮沉降对地上植物群落的结构和功能有显著影响;然而,氮富集对地下微生物群落的影响仍未得到充分阐明,特别是在功能基因结构方面。进行了为期18个月的盆栽实验,研究了氮添加速率(0、5、10和15 g N m)的影响−2·年−1)对半干旱地区原生草种Bothriochloa ischaemum根际微生物的功能基因组成进行研究,并评价与观察到的变异相关的土壤和植物变量。使用微阵列GeoChip分析,分别检测到2676、744、308和515个基因探针,分别涉及碳(C)、N、磷(P)和硫(S)循环。与本体土壤中基因响应较弱相比,氮添加显著提高了固碳(tkta、rubisco、TIM)、碳降解(amyA、ara、几丁质酶)、产甲烷生成(mcra)、氮等基因的丰度2-根际中的固定 (nifH)、反硝化作用 (narG、nirK/S、nosZ)、聚磷酸盐降解 (ppx) 和亚硫酸盐还原 (dsrA、dsrB、cysJ)。 C、N、P和S循环基因丰度随氮添加速率的增加而增加,主要受植物生物量和根系分泌物变化的调控。土壤可溶性有机碳的量对决定C、N、P和S循环相关基因的丰度起着至关重要的作用,植物生物量通过增加根系分泌物中的有机酸和溶解性有机碳间接影响基因丰度。这些发现有助于我们理解微生物在氮水平升高时的功能,并强调了根系分泌物和植物生物量在未来氮富集情景下调节微生物功能的关键作用。
利用GeoChip 5.0(60 K)功能基因阵列测定土壤中微生物功能基因的多样性和组成。
数据分析
采用单因子方差分析(ANOVA)和邓肯多重范围检验来评估氮处理对土壤特性、植物生物量、根系渗出物成分和功能基因丰度的影响。
所有原始数据均采用 Shapiro-Wilk 检验(补充 S2.1)进行正态性评估。
采用 t 检验法检验了根际土壤和块状土壤之间的差异。使用主成分分析法(PCA)对四种氮处理之间根系渗出成分的变化进行了直观分析,并通过分子方差分析(AMOVA)确定了氮处理之间的显著差异。
采用约束主坐标分析(CPCoA)来分析 N 富集对功能基因结构的影响。
相似性分析(ANOSIM)采用加权 uniFrac 距离指标来评估组间差异。
采用偏最小二乘法路径模型(PLS-PM)研究了在添加氮的条件下,土壤和植物特征对 C-、N-、P-和 S-循环基因的影响。
为了研究土壤、植物和微生物功能基因之间的联系,我们进行了斯皮尔曼相关分析。
R
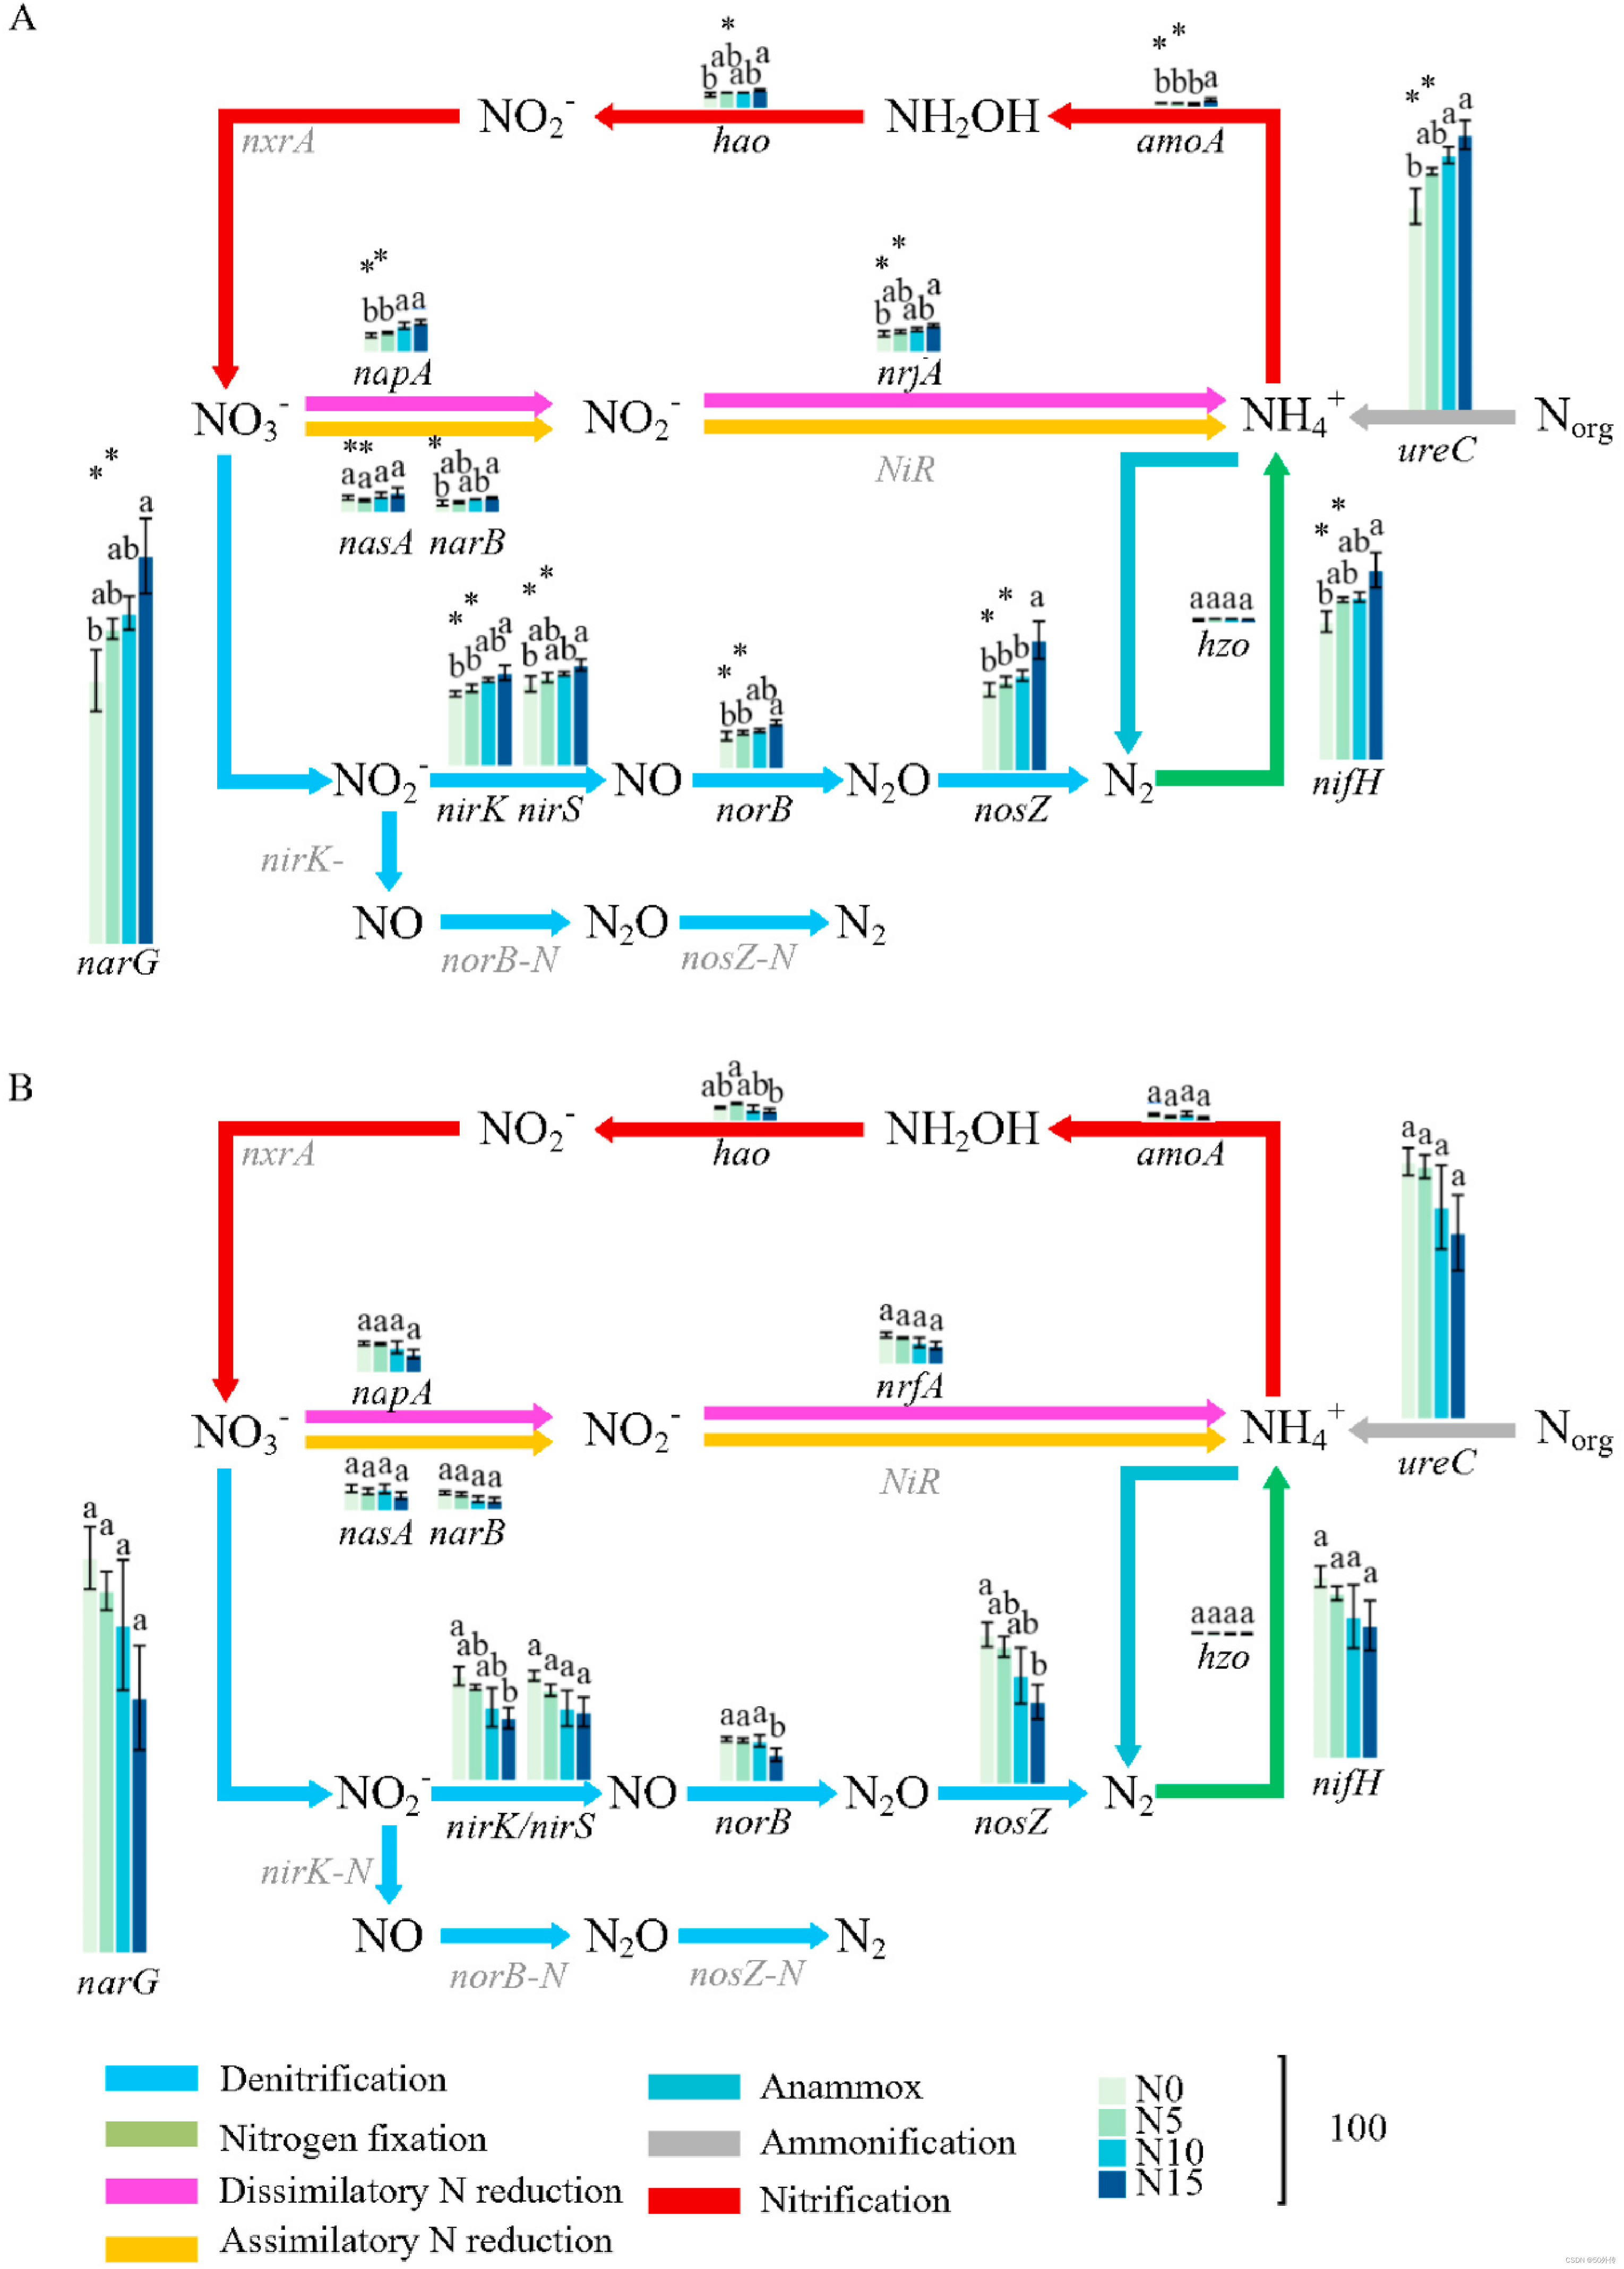
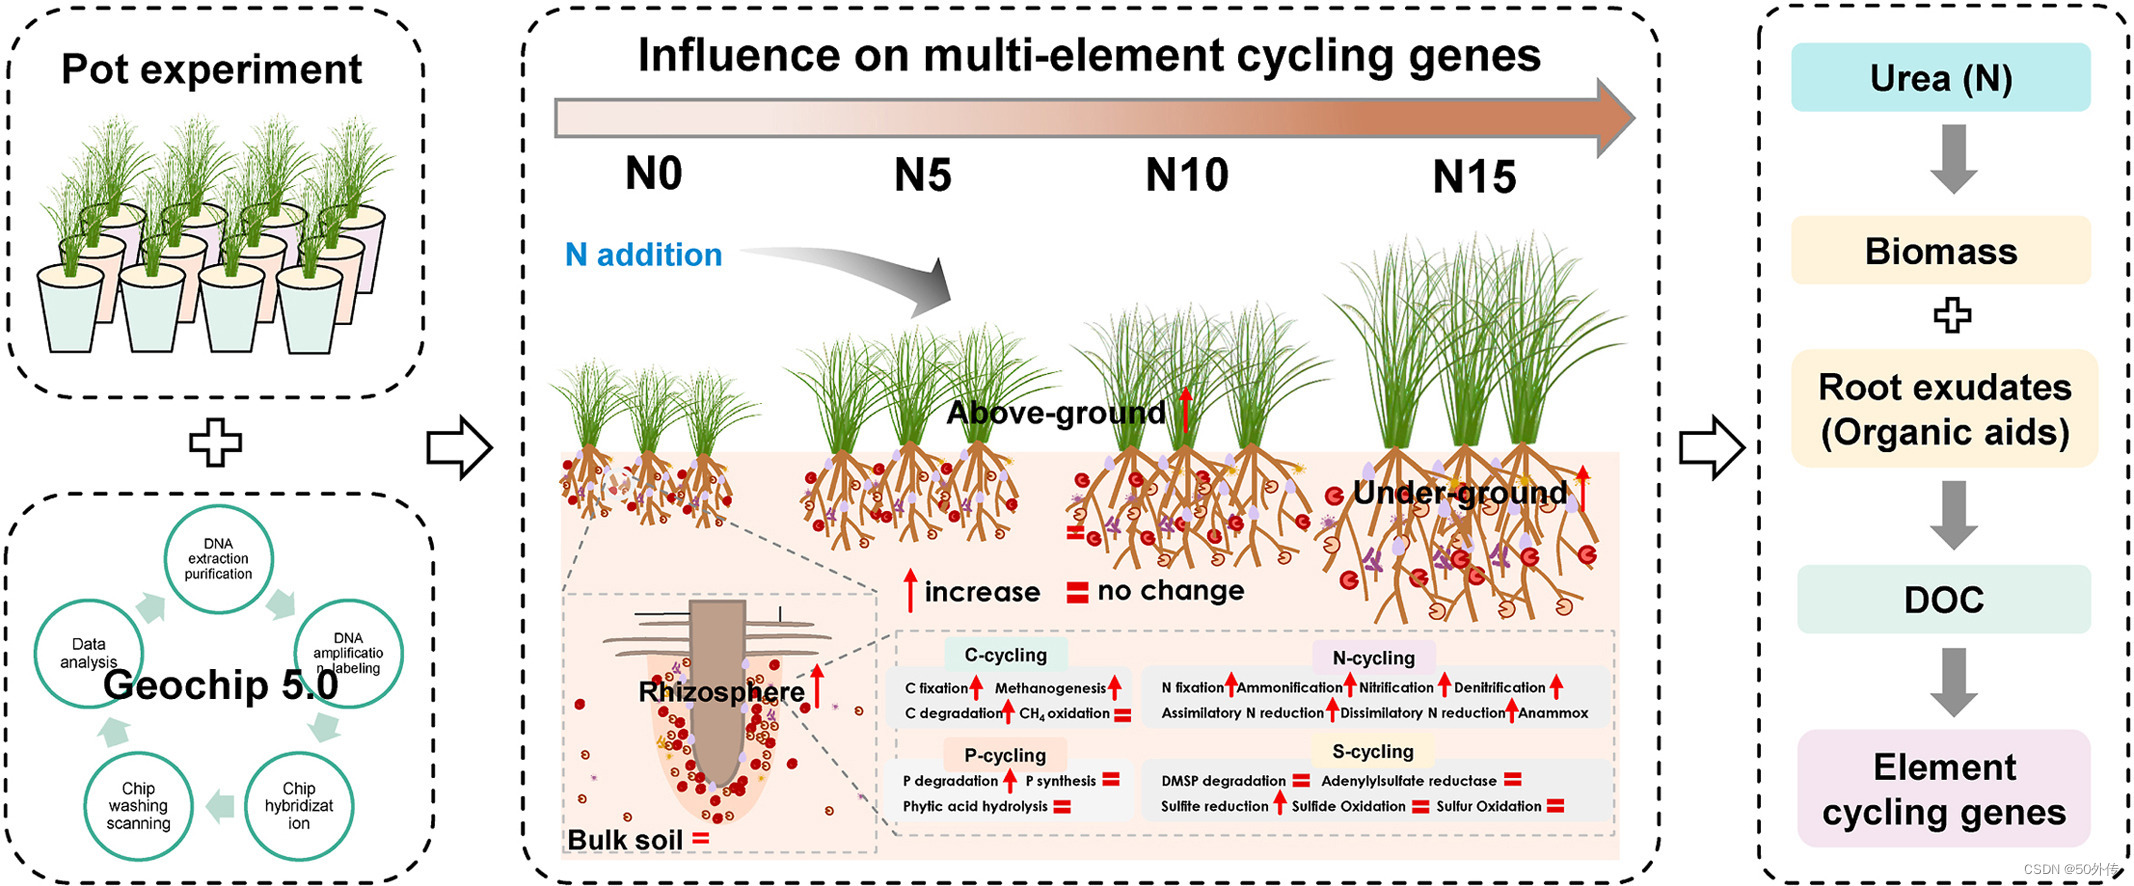
Fig. 4. Normalized average signal intensity of N-cycling genes under N addition in the rhizosphere of Bothriochloa ischaemum (A) and bulk soils (B). The values in the figure are represented as mean ± SE (n = 5). N0, no fertilizer; N5, 5 g N m−2·yr−1; N10, 10 g N m−2·yr−1; N15, 15 g N m−2·yr−1. Values followed by different letters differed significantly between treatments (One-way ANOVA followed by Duncan's multiple range test, P < 0.05). *Indicates significant difference between the rhizosphere and bulk soils conducted by t-test (P < 0.05).
Fig. 6. The partial least squares path modeling (PLS-PM) showing direct and total effects of significant soil/plant variables and the abundance of C (A, E), N (B, F), P (C, G), and S (D, H) cycling genes of rhizosphere soil of Bothriochloa ischaemum across N-addition gradient. Root exudate included organic acid, amino acids, phenols. Biomass included the aboveground and root biomass. Available N included nitrate nitrogen and ammonium nitrogen. Blue and red arrows indicate positive and negative flows of causality (P < 0.05), respectively. The width of the arrows is proportional to the strength of the relationship, and the on the arrow indicate significant standardized path coefficients. R2 indicates the variance of dependent variable explained by independent variables. DOC, dissolved organic carbon; AP: available phosphorus.


 被折叠的 条评论
为什么被折叠?
被折叠的 条评论
为什么被折叠?
 到【灌水乐园】发言


