


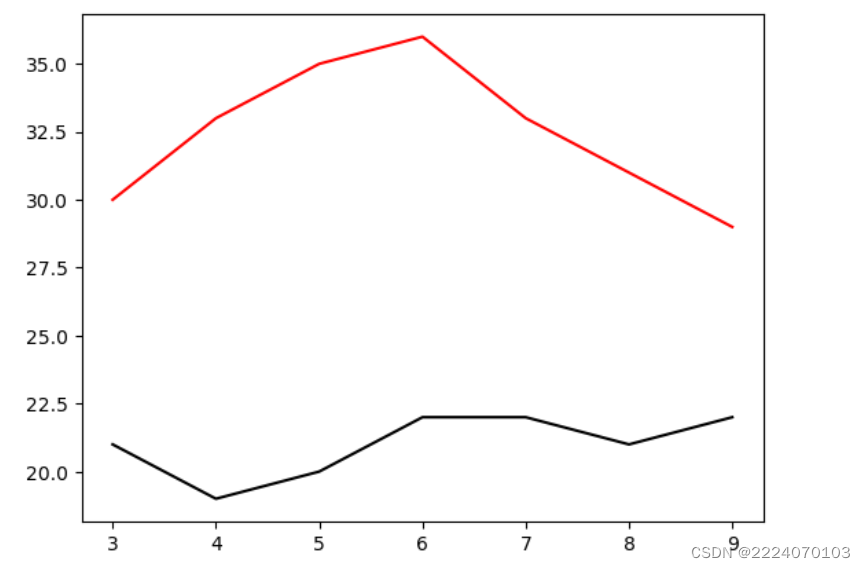
 该篇文章介绍了如何使用Python的numpy和matplotlib库创建一个简单的折线图,通过定义x轴数据和两个系列的y轴数据(最大值和最小值),展示了如何在一张图表中同时显示这两组数据。
# 导入模板
import numpy as np
import matplotlib.pyplot as plt

# 添加子图
fig=plt.figure()
ax=fig.add_subplot(111)

# 设置数据
x=np.arange(3,10)
y_max = np.array([30,33,35,36,33,31,29,])
y_min = np.array([21,19,20,22,22,21,22,])

# 绘制折线图
plt.plot(x,y_max,color='red')
plt.plot(x,y_min,color='black')
plt.show()


#展示图表
plt.show()
运行结果


 被折叠的 条评论
为什么被折叠?
被折叠的 条评论
为什么被折叠?
 到【灌水乐园】发言


