from pyecharts.charts import Bar #图像 X轴 Y轴
from pyecharts import options as opts #标题 工具
from pyecharts.globals import ThemeType #背景颜色
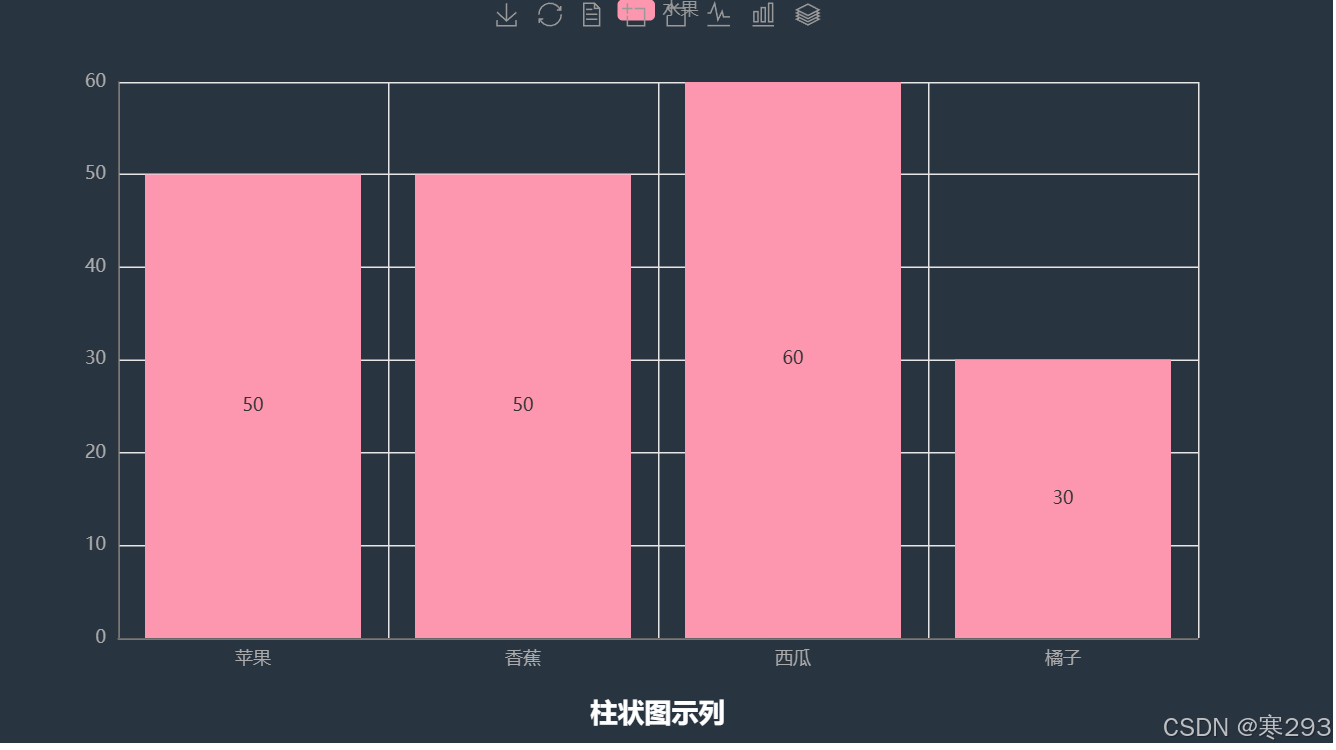
bar = Bar(init_opts=opts.InitOpts(theme=ThemeType.CHALK))
bar.add_xaxis(['苹果','香蕉','西瓜','橘子'])
bar.add_yaxis('水果',[50,50,60,30])
bar.set_global_opts(title_opts= opts.TitleOpts(title='柱状图示列',pos_left="center",pos_bottom="1%"),
toolbox_opts=opts.ToolboxOpts( # 添加工具箱
is_show=True, # 是否显示工具箱
orient="horizontal", # 工具箱方向,可选 "horizontal" 或 "vertical"
pos_left="center", # 工具箱位置
feature=opts.ToolBoxFeatureOpts( # 工具箱功能配置
save_as_image=opts.ToolBoxFeatureSaveAsImageOpts(is_show=True), # 保存为图片
restore=opts.ToolBoxFeatureRestoreOpts(is_show=True), # 重置
data_view=opts.ToolBoxFeatureDataViewOpts(is_show=True), # 数据视图
magic_type=opts.ToolBoxFeatureMagicTypeOpts(is_show=True), # 动态类型切换
data_zoom=opts.ToolBoxFeatureDataZoomOpts(is_show=True), # 数据
)
)
)
bar.render()


 634
634

 被折叠的 条评论
为什么被折叠?
被折叠的 条评论
为什么被折叠?
 到【灌水乐园】发言


