


 本文详细介绍如何使用jmap查看内存状况,包括堆配置、内存使用率及对象统计;利用jstack诊断线程状态,分析线程阻塞与等待原因;通过jstat监控JVM性能,了解GC详情;同时,jps命令用于查看JVM进程状态。
jmap(查看内存)
- -heap 打印内存统计的数据(在mac 上有bug)
- -histo[:live] 查看类在jvm中实例化的对象的统计;如果添加live参数,则只统计当前存活的对象
- jmap -dump:file=XXX.hprof,format=b pid 生成heapdump文件
jmap -heap
sh-4.1# jmap -heap 1
Attaching to process ID 1, please wait...
Debugger attached successfully.
Server compiler detected.
JVM version is 25.121-b13

using thread-local object allocation.
Parallel GC with 8 thread(s)

Heap Configuration:
   MinHeapFreeRatio         = 0
   MaxHeapFreeRatio         = 100
   MaxHeapSize              = 1073741824 (1024.0MB)
   NewSize                  = 178782208 (170.5MB)
   MaxNewSize               = 357564416 (341.0MB)
   OldSize                  = 358088704 (341.5MB)
   NewRatio                 = 2
   SurvivorRatio            = 8
   MetaspaceSize            = 268435456 (256.0MB)
   CompressedClassSpaceSize = 1073741824 (1024.0MB)
   MaxMetaspaceSize         = 268435456 (256.0MB)
   G1HeapRegionSize         = 0 (0.0MB)

Heap Usage:
PS Young Generation
Eden Space:
   capacity = 162529280 (155.0MB)
   used     = 28624512 (27.2984619140625MB)
   free     = 133904768 (127.7015380859375MB)
   17.611910912298388% used
From Space:
   capacity = 7864320 (7.5MB)
   used     = 7252384 (6.916412353515625MB)
   free     = 611936 (0.583587646484375MB)
   92.21883138020833% used
To Space:
   capacity = 8388608 (8.0MB)
   used     = 0 (0.0MB)
   free     = 8388608 (8.0MB)
   0.0% used
PS Old Generation
   capacity = 358088704 (341.5MB)
   used     = 219895648 (209.70883178710938MB)
   free     = 138193056 (131.79116821289062MB)
   61.4081498644537% used
jmap -histo:live (查看实例)
jmap -histo:live 9909

4350:             1             16  org.springframework.boot.web.servlet.server.SessionStoreDirectory
4351:             1             16  org.springframework.boot.web.servlet.server.StaticResourceJars
4352:             1             16  org.springframework.cglib.core.AbstractClassGenerator$ClassLoaderData$1
4353:             1             16  org.springframework.cglib.core.AbstractClassGenerator$ClassLoaderData$2
4354:             1             16  org.springframework.cglib.core.AbstractClassGenerator$ClassLoaderData$3
4355:             1             16  org.springframework.cglib.core.DefaultGeneratorStrategy
4356:             1             16  org.springframework.cglib.core.DefaultNamingPolicy
4357:             1             16  org.springframework.cglib.core.KeyFactory$1
4358:             1             16  org.springframework.cglib.core.KeyFactory$2
4359:             1             16  org.springframework.cglib.core.KeyFactory$3
4360:             1             16  org.springframework.cglib.core.KeyFactory$4
4361:             1             16  org.springframework.cglib.core.MethodInfoTransformer
4362:             1             16  org.springframework.cglib.core.SpringNamingPolicy
4363:             1             16  org.springframework.cglib.core.internal.LoadingCache$1
4364:             1             16  org.springframework.cglib.proxy.Enhancer$1
4365:             1             16  org.springframework.cglib.proxy.FixedValueGenerator
4366:             1             16  org.springframework.cglib.proxy.InvocationHandlerGenerator
4367:             1             16  org.springframework.cglib.proxy.LazyLoaderGenerator
jmap dump
jmap -dump:file=/data/heap_dump/9909.hprof,format=b,live 9909
Dumping heap to /data/heap_dump/9909.hprof ...
Heap dump file created
jstack(查看线程)
jstack 命令
Usage:
    jstack [-l] <pid>
        (to connect to running process)
    jstack -F [-m] [-l] <pid>
        (to connect to a hung process)
    jstack [-m] [-l] <executable> <core>
        (to connect to a core file)
    jstack [-m] [-l] [server_id@]<remote server IP or hostname>
        (to connect to a remote debug server)

Options:
    -F  to force a thread dump. Use when jstack <pid> does not respond (process is hung) //当线程没有响应时,强制dumo
    -m  to print both java and native frames (mixed mode) //很少用,会打印底层 c/c++的相关堆栈信息
    -l  long listing. Prints additional information about locks //很少用,会让线程停顿时间更长
    -h or -help to print this help message
线程的状态
NEW,未启动的。不会出现在Dump中。
RUNNABLE,在虚拟机内执行的。
BLOCKED,受阻塞并等待监视器锁。
WATING,无限期等待另一个线程执行特定操作。
TIMED_WATING,有时限的等待另一个线程的特定操作。
TERMINATED,已退出的。
jstack 线程占用CPU分析
- 找出 java 对应的进程id pid;
- 找出对应pid中最耗费cpu的tid; linux 命令:
top -Hp pid - 将tid转换对应的十六进制;linux 命令:
printf "%x\n tid"cha - 获得对应的堆栈信息;linux 命令:
jstack pid|grep 十六进制tid - 分析代码
jstack Dump文件分析
dump文件中线程的含义以及注意事项
- Deadlock : 死锁线程
- Runnable : 正在运行的线程(一般指该线程正在执行状态中,该线程占用了资源,正在处理某个请求,有可能正在传递SQL到数据库执行,有可能在对某个文件操作,有可能进行数据类型等转换。)
- Waiting on Condition:等待资源或者等待某个条件的发生;这里肯定不是 object.wait的情况
- 该线程正在等待资源;该资源采用了资源锁的情况,等待资源的释放,然后进行读取
- 正在等待其他资源得的执行
- 如果发现大量 Waiting on Condition;从线程stack看,正在等待网络读写,是一个网络瓶颈的征兆
- 线程正在sleep,等到sleep完成后,线程会被唤醒。
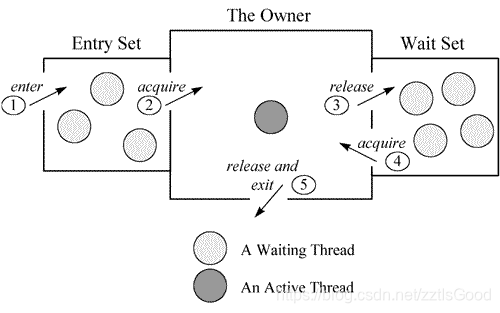
- Waiting for monitor entry 和 in Object.wait():Monitor是 Java中用以实现线程之间的互斥与协作的主要手段,它可以看成是对象或者 Class的锁。每一个对象都有,也仅有一个 monitor。在 “Entry Set”中等待的线程状态是 “Waiting for monitor entry”,而在 “Wait Set”中等待的线程状态是 “in Object.wait()”。
进入区(Entrt
Set):表示线程通过synchronized要求获取对象的锁。如果对象未被锁住,则迚入拥有者;否则则在进入区等待。一旦对象锁被其他线程释放,立即参与竞争。拥有者(The Owner):表示某一线程成功竞争到对象锁。
等待区(Wait Set):表示线程通过对象的wait方法,释放对象的锁,并在等待区等待被唤醒。
综合示范
- Waiting to lock 和 Blocked 有锁阻塞
- Waiting on condition 和 TIMED_WAITING 条件等待,等待其他条件的出发来唤醒该线程;超时则退出
- in Obejct.wait() 和 TIMED_WAITING 进入了java的monitor;在wait set中;等待唤醒
jstat(性能分析)
jstat 命令
jstat [ generalOption | outputOptions vmid [interval[s|ms] [count]] ]

//例如(输出的是GC信息,采样时间间隔为250ms,采样数为4):
root@ubuntu:/# jstat -gc 21711 250 4
 S0C    S1C    S0U    S1U      EC       EU        OC         OU       PC     PU    YGC     YGCT    FGC    FGCT     GCT
192.0  192.0   64.0   0.0    6144.0   1854.9   32000.0     4111.6   55296.0 25472.7    702    0.431   3      0.218    0.649
192.0  192.0   64.0   0.0    6144.0   1972.2   32000.0     4111.6   55296.0 25472.7    702    0.431   3      0.218    0.649
192.0  192.0   64.0   0.0    6144.0   1972.2   32000.0     4111.6   55296.0 25472.7    702    0.431   3      0.218    0.649
192.0  192.0   64.0   0.0    6144.0   2109.7   32000.0     4111.6   55296.0 25472.7    702    0.431   3      0.218    0.649
常用选项:
- 显示内存使用情况,具体参数单位kb
jstat -gc pid - 显示内存使用占比,
jstat -gcutil pid
其他使用参数命令:
jps ( jps主要用来输出JVM中运行的进程状态信息。)
jps [options] [hostid]

-q 不输出类名、Jar名和传入main方法的参数
-m 输出传入main方法的参数
-l 输出main类或Jar的全限名
-v 输出传入JVM的参数


 780
780

 被折叠的 条评论
为什么被折叠?
被折叠的 条评论
为什么被折叠?
 到【灌水乐园】发言


