


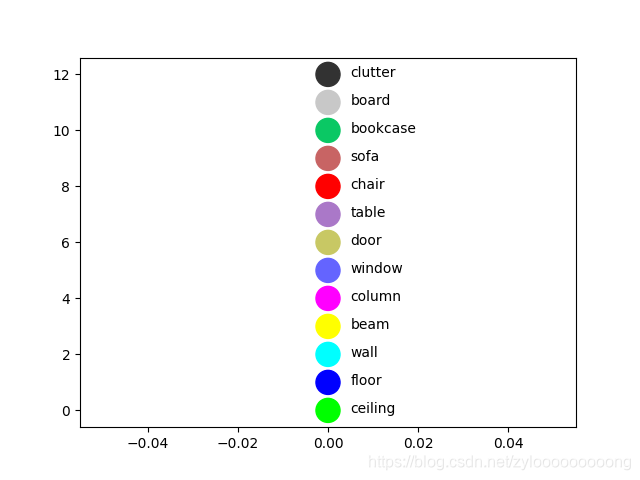
 本文通过Matplotlib展示了不同类别点云的颜色可视化效果。利用numpy生成颜色数组,并将这些颜色映射到点云的不同类别上,最终通过散点图的形式直观展示每个类别的颜色。
弄点云可视化的时候想看看每个类别的点可视化出来到底是什么颜色的。
import matplotlib.pyplot as plt
import numpy as np

label = ['ceiling',
		         'floor',
		         'wall',
		         'beam',
		         'column',
		         'window',
		         'door',
		         'table',
		         'chair',
		         'sofa',
		         'bookcase',
		         'board',
		         'clutter']
color = np.array([[0,255,0],
					                [0,0,255],
					                [0,255,255],
					                [255,255,0],
					                [255,0,255],
					                [100,100,255],
					                [200,200,100],
					                [170,120,200],
					                [255,0,0],
					                [200,100,100],
					                [10,200,100],
					                [200,200,200],
					                [50,50,50]])/255.0
color = tuple(color)

x = np.zeros((len(label)))
y = np.arange(len(label))
fig, ax = plt.subplots()
ax.scatter(x, y, c=color, s=300)
for i, txt in enumerate(label):
    ax.annotate(txt, (x[i]+0.005, y[i]-0.1))
plt.show()
结果:


 被折叠的 条评论
为什么被折叠?
被折叠的 条评论
为什么被折叠?
 到【灌水乐园】发言


