<template>
<div class="about">
<h1>This is an about page</h1>
<div id="minBox" style="width: 40rem; height: 40rem"></div>
</div>
</template>
<script>
import * as echarts from "echarts";
export default {
mounted() {
// 基于准备好的dom,初始化echarts实例
var myChart = echarts.init(document.getElementById("minBox"));
// 绘制图表
myChart.setOption({
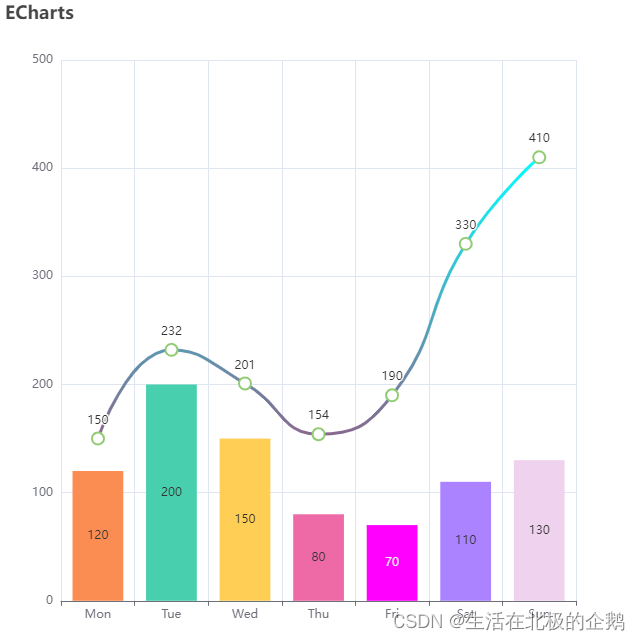
title: {
text: "ECharts",
},
// 数值显示
label: {
show: true,
},
xAxis: {
type: "category",
data: ["Mon", "Tue", "Wed", "Thu", "Fri", "Sat", "Sun"],
splitLine: { show: true }, // 接线图 竖线
axisLabel: { interval: 0 }, // X显示 隔几个显示 一次
},
yAxis: {
type: "value",
},
// 调整折线图的边距和位置
grid: {
left: "5%", //距离左侧边距
right: "10%",
bottom: "3%",
containLabel: true,
},
// 功能 展示
toolbox: {
show: true,
feature: {
mark: { show: true },
dataView: { show: true, readOnly: false }, // 数据视图
restore: { show: true }, // 还原
saveAsImage: { show: true }, // 下载 ECharts 成图片
},
},
// 更改鼠标移动上去的效果
tooltip: {
trigger: "axis", // 触发类型,可选值: 'item'(数据项触发),'axis'(坐标轴触发),'none'(不触发)
axisPointer: {
// 可选值: 'line'(直线指示器),'shadow'(阴影指示器),'cross'(十字准星指示器)
type: "cross", // 设置触发提示的指示器类型
// 当前 label选中颜色
label: {
backgroundColor: "#1187F4",
},
// Y轴 线条颜色
lineStyle: {
color: "red",
},
// X轴 线条颜色
crossStyle: {
color: "#42B983",
},
// 阴影指示器 背景色
shadowStyle: {
color: "rgba(150,150,150,0.3)",
},
},
// 提示框 背景色
backgroundColor: "rgba(0,0,0,0.2)",
// 提示框 内边距
padding: [20, 10],
textStyle: {
// 文本样式
color: "#fff", // 文本颜色
fontSize: 12, // 文本字号
},
},
series: [
{
data: [120, 200, 150, 80, 70, 110, 130],
type: "bar",
animation: true, //动画的缓动方式
// animationEasing: "cubicOut", //动画的缓动方式
animationDuration: 1000, //持续时间
itemStyle: {
normal: {
//这里是重点
color: function (params) {
//注意,如果颜色太少的话,后面颜色不会自动循环,最好多定义几个颜色
var colorList = [
"#FC8D52",
"#48CFAE",
"#FFCE55",
"#EE6AA7",
"#FF00FF",
"#AB82FF",
"#EED2EE",
];
return colorList[params.dataIndex];
},
},
},
},
// 第一条 线
{
name: "销量1", // 鼠标划入提示文字
type: "line",
animation: true, //动画的缓动方式
// animationEasing: "cubicOut", //动画的缓动方式
animationDuration: 4500, //持续时间
smooth: true, // smooth 折线图的线 true: 曲线; false: 直线(默认)
data: [150, 232, 201, 154, 190, 330, 410],
symbolSize: 12, // 设置拐点小圆点大小
// markPoint: {
// symbol: "roundRect", // 设置拐点小圆点
// },
// 选中高亮
emphasis: {
focus: "series",
},
// 折线图 背景色颜色渐变
// areaStyle: {
// // 颜色渐变
// normal: {
// color: new echarts.graphic.LinearGradient(0, 0, 0, 1, [
// { offset: 0, color: "#C0FF3E" },
// { offset: 0.5, color: "#B3EE3A" },
// { offset: 1, color: "#9ACD32" },
// ]),
// },
// },
// 折线图 线条颜色渐变
lineStyle: {
// 系列级个性化折线样式
width: 3,
type: "solid", // 线条形状 dashed: 线段; solid: 线条;
color: new echarts.graphic.LinearGradient(0, 0, 0, 1, [
{
offset: 0,
color: "#00FFFF",
},
{
offset: 1,
color: "#8B658B",
},
]),
},
},
],
});
},
};
</script>


 被折叠的 条评论
为什么被折叠?
被折叠的 条评论
为什么被折叠?
 到【灌水乐园】发言


