import numpy as np
import matplotlib.pyplot as plt
%matplotlib inline
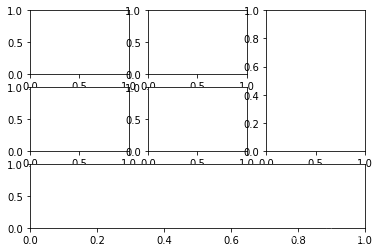
子图布局
ax1 = plt.subplot2grid((3,3), (0,0))
ax2 = plt.subplot2grid((3,3), (0,1))
ax3 = plt.subplot2grid((3,3), (1,0))
ax4 = plt.subplot2grid((3,3), (1,1))
ax5 = plt.subplot2grid((3,3), (0,2), rowspan=2)
ax6 = plt.subplot2grid((3,3), (2,0), colspan=3)
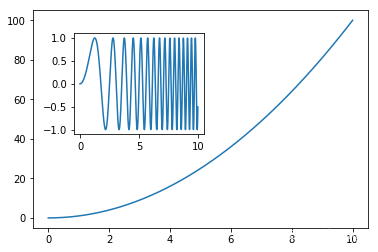
子图嵌套
x = np.linspace(0,10,1000)
y2 = np.sin(x**2)
y1 = x**2
fig, ax1 = plt.subplots()
left, bottom, width, height = [0.22,0.45,0.3,0.35]
ax2 = fig.add_axes([left,bottom,width,height])
ax1.plot(x,y1)
ax2.plot(x,y2)
[<matplotlib.lines.Line2D at 0x26272f307b8>]
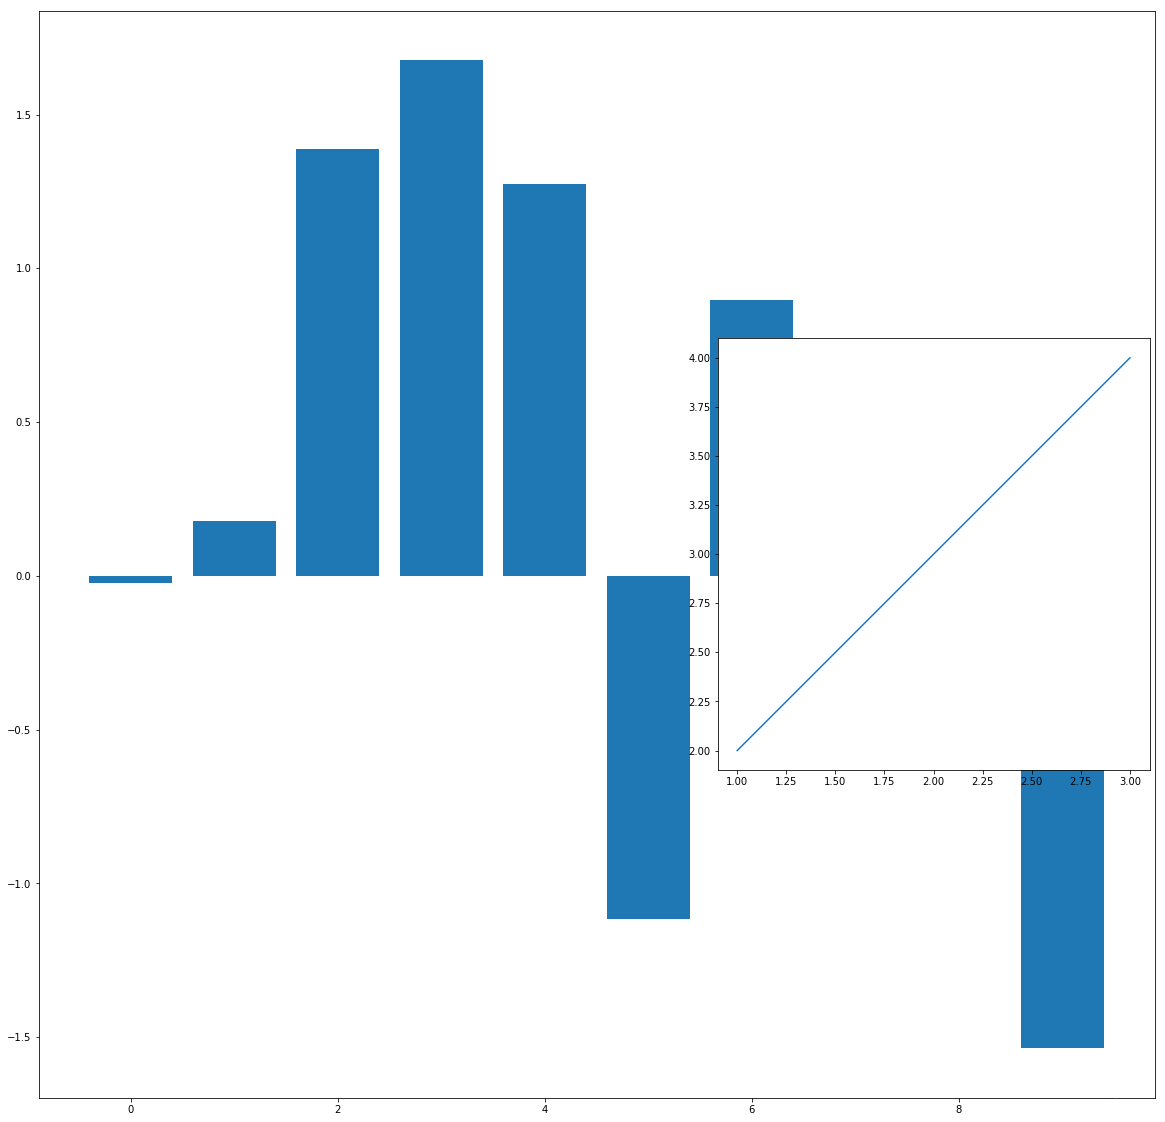
from mpl_toolkits.axes_grid.inset_locator import inset_axes

fig, ax1 = plt.subplots(figsize=(20,20))
ax1.bar(range(10),np.random.randn(10))
ax2 = inset_axes(ax1, width=6, height=6, loc=5)
ax2.plot([1,2,3],[2,3,4])
[<matplotlib.lines.Line2D at 0x26273030748>]


 被折叠的 条评论
为什么被折叠?
被折叠的 条评论
为什么被折叠?
 到【灌水乐园】发言


