


import numpy as np
import matplotlib.pyplot as plt
# 不用打imshow也能显示
%matplotlib inline
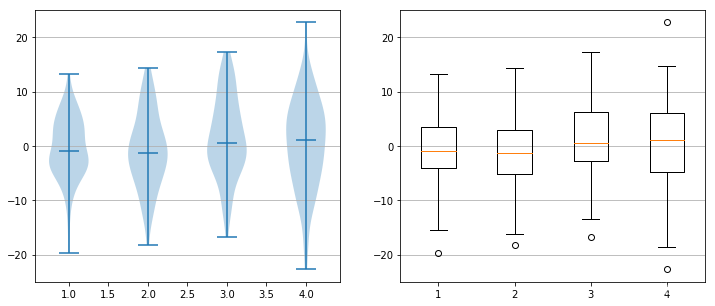
小提琴图
与盒图不同的时,小提琴图有胖瘦,胖的地方值多
fig, axes = plt.subplots(nrows=1, ncols=2, figsize=(12,5))
x = [np.random.normal(0,std,100) for std in range(6,10)]

axes[0].violinplot(x, showmeans=False, showmedians=True)

axes[1].boxplot(x)

# 加上更直观
for ax in axes:
    ax.yaxis.grid(True)


 被折叠的 条评论
为什么被折叠?
被折叠的 条评论
为什么被折叠?
 到【灌水乐园】发言


