pca
1 PCAtools
1.1 加载R包
library(PCAtools)
library(tidyverse)
1.2 加载数据,构建表达矩阵和分组信息(以iris为例)
iris <- as.data.frame(iris)
iris <- iris %>% mutate(class = str_c("a",1:dim(iris)[1],sep = ""))
rownames(iris) <- iris$class
iris <- iris[,-6]
head(iris)
Sepal.Length Sepal.Width Petal.Length Petal.Width Species
a1 5.1 3.5 1.4 0.2 setosa
a2 4.9 3.0 1.4 0.2 setosa
a3 4.7 3.2 1.3 0.2 setosa
a4 4.6 3.1 1.5 0.2 setosa
a5 5.0 3.6 1.4 0.2 setosa
a6 5.4 3.9 1.7 0.4 setosa
expr=iris[c(1,2,3,4)]
head(expr)
Sepal.Length Sepal.Width Petal.Length Petal.Width Species
a1 5.1 3.5 1.4 0.2 setosa
a2 4.9 3.0 1.4 0.2 setosa
a3 4.7 3.2 1.3 0.2 setosa
a4 4.6 3.1 1.5 0.2 setosa
a5 5.0 3.6 1.4 0.2 setosa
a6 5.4 3.9 1.7 0.4 setosa
class <- iris[5]
head(class)
Species
a1 setosa
a2 setosa
a3 setosa
a4 setosa
a5 setosa
a6 setosa
1.3 表达矩阵标准化
expr <- scale(expr)
head(expr)
Sepal.Length Sepal.Width Petal.Length Petal.Width
a1 -0.8976739 1.01560199 -1.335752 -1.311052
a2 -1.1392005 -0.13153881 -1.335752 -1.311052
a3 -1.3807271 0.32731751 -1.392399 -1.311052
a4 -1.5014904 0.09788935 -1.279104 -1.311052
a5 -1.0184372 1.24503015 -1.335752 -1.311052
a6 -0.5353840 1.93331463 -1.165809 -1.048667
1.4 数据转置
expr <-t(expr)
expr[,c(1:4)]
a1 a2 a3 a4
Sepal.Length -0.8976739 -1.1392005 -1.3807271 -1.50149039
Sepal.Width 1.0156020 -0.1315388 0.3273175 0.09788935
Petal.Length -1.3357516 -1.3357516 -1.3923993 -1.27910398
Petal.Width -1.3110521 -1.3110521 -1.3110521 -1.31105215
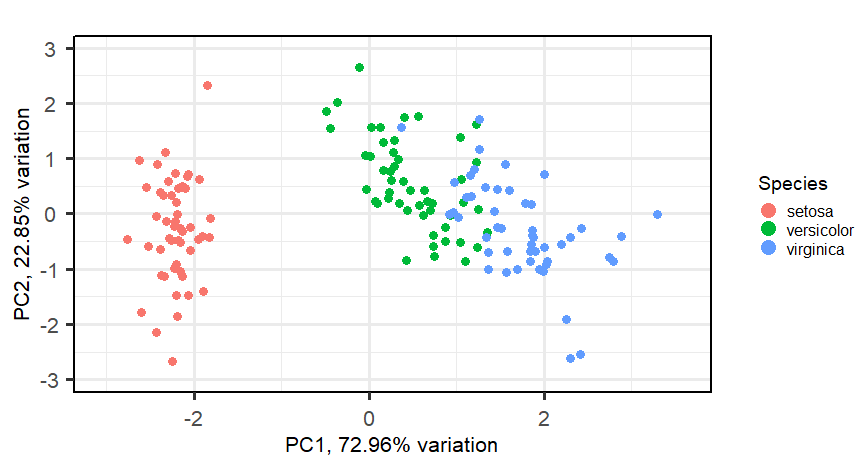
1.4 pca分析
pca <- pca(expr, metadata = class)
biplot(pca,x="PC1",y="PC2",,colby = "Species",legendPosition = "right",lab = NULL)


 145
145

 被折叠的 条评论
为什么被折叠?
被折叠的 条评论
为什么被折叠?
 到【灌水乐园】发言


