想要图表在jupyter里面显示,需要设置
用到的包:
import matplotlib.pyplot as plt

# set this so the
%matplotlib inline  #魔术贴
图表基本元素
1、设置图表大小:figsize
plt.figure(figsize=(10,10))
2、图表标题:title
plt.title('xxx')
3、X,Y轴标签
plt.xlabel('X')
plt.ylabel('Y')
4、图例显示位置:legend
plt.legend(loc = 'best') #自动选择一个最佳位置显示
图表参数
1、直方图表的颜色、透明度
plt.hist(np.random.randn(100),
        color = 'red',alpha = 0.8) #color是直方图的颜色,alpha是直方图的透明度
2、图上显示标签
plt.text(5,0.5,'sss',fontsize=10) #(5,0.5)坐标上显示sss
3、图片保存
plt.savefig()
4、子图
fig = plt.figure(figsize=(10,6)) #创建一个大图

ax1 = fig.add_subplot(2,2,1) #大图是2行两列的,现在在第一行左图
ax1.plot()

ax2 = fig.add_subplot(2,2,2) #第一行右图
ax2.plot()
方式二:用的比较多
fig,axes = plt.subplots(2,3,figsize(10,4)) #创建一个有两行三列的图

axes[0,1].plot(np.random.rand(100))  #在第一行第二个图中作图
基本图表绘制
柱状图、堆叠图
第一种方式:
df.plot(kind='line',rot=45)  #简单图表的绘制,rot:横坐标旋转的角度

#line:线形图
#bar:柱状图

df.plot(kind='bar',stacked=True,colormap = 'BuGn_r') #柱状堆叠图,colormap:系列的配色
第二种绘图方式
plt.bar(数据,with=1,....)
#with:柱子宽度占比
#facecolor:柱子的颜色

与上面df.plot绘制图表的区别是这种方式参数更多

for i,j in zip(x,y1):
    plt.text(i+0.3,j-0.15,'%.2f' %j,color='white')
面积图
df.plot.area(colormap='Greens_r') stacked=True的情况下,堆叠显示,要求数据为全部正值或全部负值
饼图
plt.pie(series,...)
#series:数据
#explode:指定每部分偏移量
#colors:颜色
直方图 :看数据分布
s.hist(bins=10,range=None,normed=False,histtype='bar',align='mid',orientation='vertical')
x:数据
#bin:箱子的宽度
#normed 标准化
#histtype 风格 {bar step stepfilled}
#orientation 水平还是垂直
#align:{left,mid,right}  一般mid
#optional:对齐方式


密度图:
s.plot(kind='kde',style='k--')

#堆叠直方图
df.plot.hist(stacked=True,bins=20....)
散点图:
plt.scatter(x,y,s=20...)
# x,y数据
# s:散点的大小 可以是df中某一列值 乘上一个 标量
# c:散点的颜色 可以根据性别一列男女显示两种颜色  值必须是数字
散点矩阵图:pandas方法 看出df每列之间的联系
pd.scatter_matrix(df,figsize=(10,6),diagonal='kde')
#diagonal:({'hist','kde'}) 必须在两个类型中选一个,每个指标的频率图
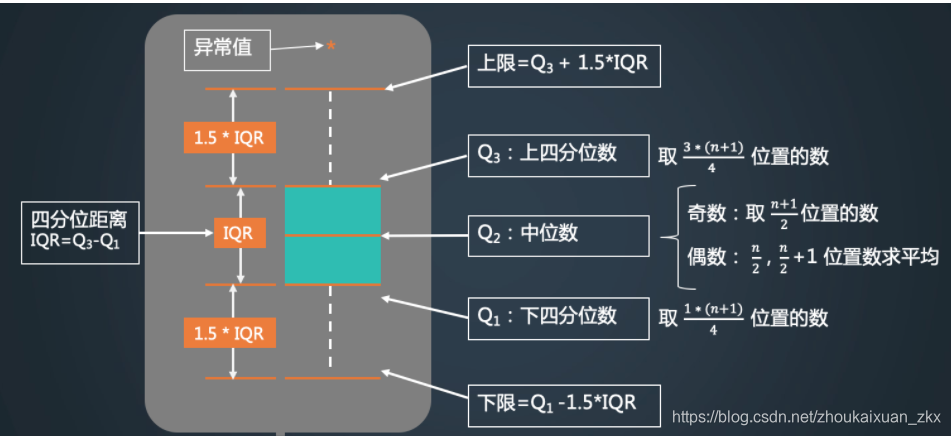
箱型图:用于显示一组数据分散情况
包含一组数据的:最大值,最小值,中位数,上四分位数(Q1)、下四分位数(Q3)、异常值

df.plot.box()  #方法一

df.boxplot() #方法二
例子:
饼图:
males = (titanic['Sex']=='male').sum()
females = (titanic['Sex'] == 'female').sum()

# put them into a list called proportions
proportions = [males, females]

plt.pie(
    # using proportions
    proportions,

   # with the labels being officer names
    labels = ['Males', 'Females'],

   # with no shadows
    shadow = False,

   # with colors
    colors = ['blue','red'],

  # with one slide exploded out
    explode = (0.15 , 0),

  # with the start angle at 90%
    startangle = 90,

  # with the percent listed as a fraction
    autopct = '%1.1f%%'
)
# View the plot drop above
plt.axis('equal')

# Set labels
plt.title("Sex Proportion")

# View the plot
plt.tight_layout()
plt.show()


 本文介绍了如何利用pandas和Matplotlib在Jupyter环境中创建和定制图表,包括设置图表大小、添加标题和轴标签、图例位置等。讨论了直方图、散点图、柱状图、面积图、饼图和箱型图的绘制方法,以及如何通过调整颜色、透明度和显示标签来增强图表的视觉效果。


 7687
7687

 被折叠的 条评论
为什么被折叠?


