


最近需要监控Golang API的性能,学了Golang的Prometheus,做了相关笔记,分享一下,哪里理解的不对欢迎大家帮忙指正吖~
参考链接:
Prometheus 监控服务 Golang 应用接入-接入指南-文档中心-腾讯云
1. Golang Prometheus
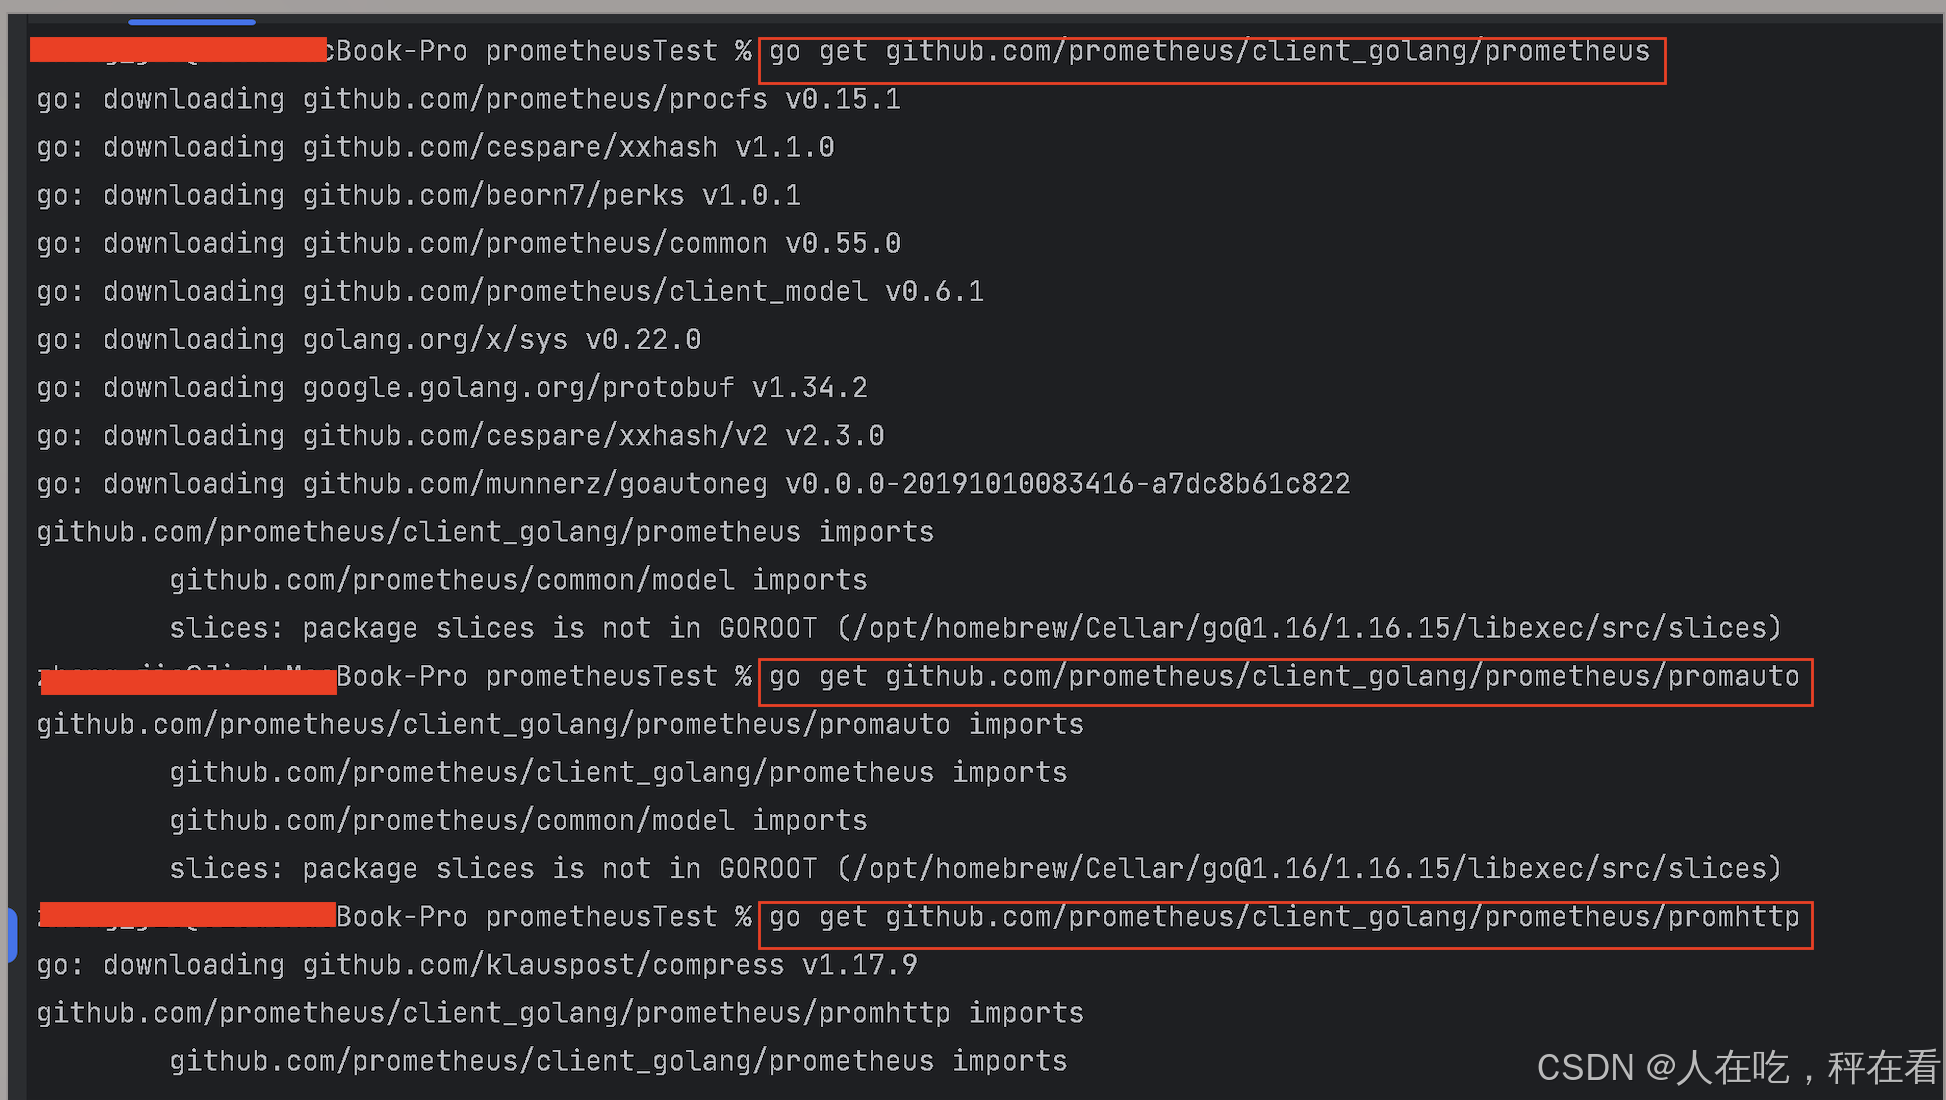
注意:golang 1.15以上才支持prometheus,安装需要用到的包:
1.1 公开性能数据的接口
相关代码已经上传到对应gitcode,可进行搜索下载:golang-prometheus-testGitCode - 全球开发者的开源社区,开源代码托管平台
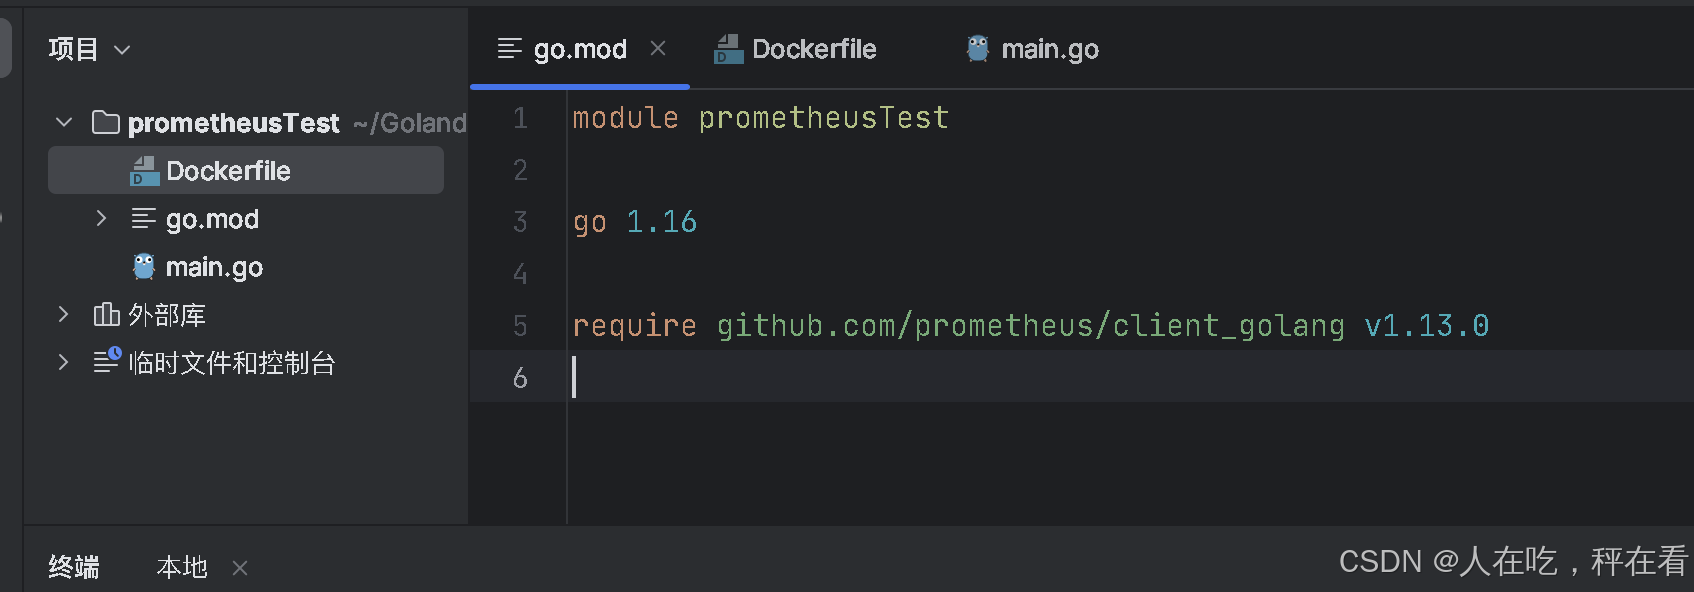
我这里的golang版本是1.16的对应安装prometheus应该是1.13.0版本, 具体的go.mod文件:
定义一个能查看性能的接口:
package main

import (
	"github.com/gin-gonic/gin"
	"github.com/prometheus/client_golang/prometheus"
	"github.com/prometheus/client_golang/prometheus/promauto"
	"github.com/prometheus/client_golang/prometheus/promhttp"
	"net/http"
	"runtime"
	"sync"
	"time"
)

type Collector struct {
	// HTTP请求相关指标
	requestCounter  *prometheus.CounterVec
	requestDuration *prometheus.HistogramVec
	requestInFlight *prometheus.GaugeVec

	// 系统资源指标
	cpuUsage       *prometheus.GaugeVec
	memoryUsage    *prometheus.GaugeVec
	goroutineCount prometheus.Gauge

	// 业务指标
	businessCounter *prometheus.CounterVec
	queueLength     *prometheus.GaugeVec

	// 错误指标
	errorCounter *prometheus.CounterVec

	mu sync.RWMutex
}

func NewCollector(namespace string) *Collector {
	return &Collector{
		requestCounter: promauto.NewCounterVec(
			prometheus.CounterOpts{
				Namespace: namespace,
				Name:      "http_requests_total",
				Help:      "Total number of HTTP requests",
			},
			[]string{"method", "path", "status"},
		),

		requestDuration: promauto.NewHistogramVec(
			prometheus.HistogramOpts{
				Namespace: namespace,
				Name:      "http_request_duration_seconds",
				Help:      "HTTP request duration in seconds",
				Buckets:   []float64{0.1, 0.3, 0.5, 0.7, 0.9, 1.0, 1.5, 2.0},
			},
			[]string{"method", "path"},
		),

		requestInFlight: promauto.NewGaugeVec(
			prometheus.GaugeOpts{
				Namespace: namespace,
				Name:      "http_requests_in_flight",
				Help:      "Current number of HTTP requests being processed",
			},
			[]string{"method"},
		),
 最低0.47元/天 解锁文章


 1838
1838

 被折叠的 条评论
为什么被折叠?
被折叠的 条评论
为什么被折叠?
 到【灌水乐园】发言


