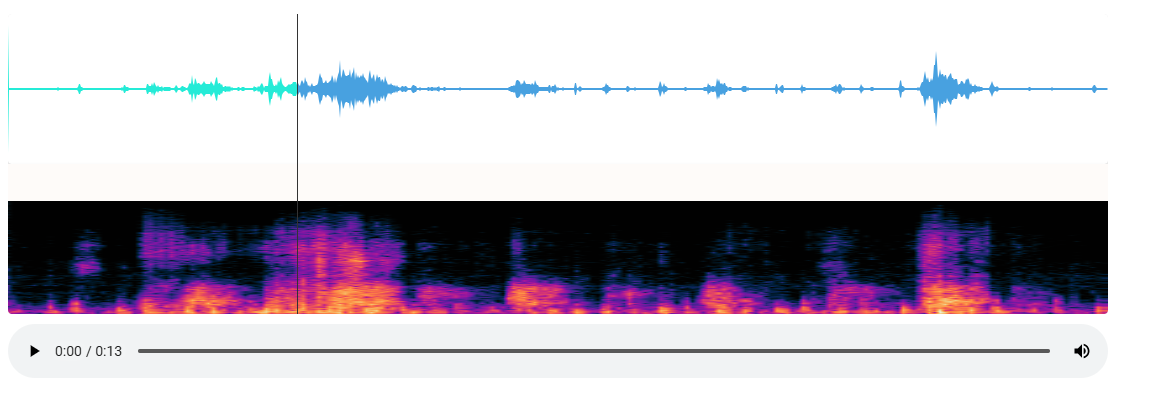
 Vue使用wavesurfer.js绘制音频图表


新的实现方式:vue使用Canvas绘制频谱图
安装wavesurfer.js
npm install wavesurfer.js
第一版:
组件特点:
- 一次性加载好所有的数据;
<template>
  <div class="audio-visualizer-container">
    <div class="visualization-container">
      <div ref="waveform" class="waveform"></div>
      <div ref="spectrogram" class="spectrogram"></div>
      <div v-if="loading" class="loading-indicator">音频加载中...</div>
      <div v-if="error" class="error-message">{{ error }}</div>
    </div>

    <div class="audio-controls">
      <audio
        ref="audioPlayer"
        controls
        @play="startPlay"
        @pause="stopPlay"
        @seeked="handleSeek"
        controlsList="nodownload noplaybackrate"
      ></audio>
    </div>
  </div>
</template>

<script>
import axios from 'axios'
import Vue from 'vue'
import { ACCESS_TOKEN } from '@/store/mutation-types'
import WaveSurfer from 'wavesurfer.js'
import Spectrogram from 'wavesurfer.js/dist/plugins/spectrogram.esm.js'
// https://juejin.cn/post/6979191645916889095

export default {
  name: 'AudioWaveform',
  props: {
    audioUrl: {
      type: String,
      required: true,
    },
  },
  data() {
    return {
      wavesurfer: null,
      spectrogramPlugin: null,
      isPlaying: false,
      audioBlobUrl: null,
      loading: false,
      error: null,
      isUserInteraction: false, // 标记是否是用户交互
    }
  },
  watch: {
    audioUrl(newVal) {
      this.handleAudioUrl(newVal)
    },
  },
  mounted() {
    this.initWaveSurfer()
    this.handleAudioUrl(this.audioUrl)
  },
  beforeDestroy() {
    this.cleanup()
  },
  methods: {
    async initWaveSurfer() {
      try {
        this.wavesurfer = WaveSurfer.create({
          container: this.$refs.waveform,
          waveColor: '#48a1e0',
          progressColor: '#25ebd7',
          cursorColor: '#333',
          // cursorWidth: 1,
          // barWidth: 2,
          // barRadius: 3,
          height: 150,
          sampleRate: 8000, // 明确指定采样率
          // normalize: true,
          // backend: 'WebAudio',

          // renderFunction: (channels, ctx) => {
          //   console.log('Custom render function called!') // 确保执行
          //   // this.drawWaveform(ctx, channels[0]) // 使用第一个声道数据绘制波形

          //   const { width, height } = ctx.canvas
          //   const channelData = channels[0] // 使用左声道数据
          //   const dataLength = channelData.length
          //   const step = Math.max(1, Math.floor(dataLength / width)) // 确保步长≥1,避免除零

          //   ctx.beginPath()
          //   ctx.lineWidth = 1
          //   ctx.strokeStyle = '#48a1e0' // 波形颜色

          //   // 中心线位置(对称波形)
          //   const centerY = height / 2

          //   for (let i = 0; i < width; i++) {
          //     // 使用 step 控制数据采样间隔
          //     const dataIndex = Math.min(Math.floor(i * step), dataLength - 1) // 防止数组越界
          //     const value = channelData[dataIndex] // 获取振幅值(-1 到 1)

          //     // 映射振幅到 Canvas 高度
          //     const amplitude = value * centerY
          //     console.log(`绘制点: x=${i},value=${value} amplitude=${amplitude} realMv=${this.calcRealMv(value)}`) // 调试输出
          //     const x = i
          //     const y = centerY - amplitude // 向上为正,向下为负

          //     if (i === 0) {
          //       ctx.moveTo(x, y)
          //     } else {
          //       ctx.lineTo(x, y)
          //     }
          //   }

          //   ctx.stroke() // 绘制路径
          //   ctx.closePath()
          // },
        })
        // 初始化频谱图插件
        this.spectrogramPlugin = this.wavesurfer.registerPlugin(
          Spectrogram.create({
            container: this.$refs.spectrogram,
            // labels: true,
            // labelsBackground: 'rgba(0,0,0,0.1)', //频率标签的背景
            height: 150,
            fftSamples: 1024,
            frequencyMax: 8000, //最大显示频率
            frequencyMin: 0, //显示最小频率
            colorMap: 'roseus',
            windowFunc: 'hann', // 使用汉宁窗函数
            alpha: 1, // 完全不透明
          })
        )

        this.wavesurfer.on('ready', () => {
          console.log('WaveSurfer ready')
          //  this.$refs.spectrogram.style.height = '150px' // 强制设置高度

          if (this.wavesurfer && this.wavesurfer.backend) {
            this.wavesurfer.backend.setAudioElement(this.$refs.audioPlayer)
          }
        })

        this.wavesurfer.on('error', (err) => {
          console.error('WaveSurfer error:', err)
          this.error = '音频处理错误: ' + err
        })

        // 监听用户交互事件
        this.wavesurfer.on('interaction', () => {
          this.isUserInteraction = true
        })

        // 监听波形图进度变化
        this.wavesurfer.on('timeupdate', (currentTime) => {
          if (this.isUserInteraction) {
            this.$refs.audioPlayer.currentTime = currentTime
            this.isUserInteraction = false // 重置标志
          }
        })
      } catch (err) {
        console.error('初始化失败:', err)
        this.error = '初始化失败: ' + err.message
      }
    },
    calcRealMv(point) {
      return (point * 3.3) / 32767
    },
    async handleAudioUrl(audioUrl) {
      if (!audioUrl) return

      try {
        this.loading = true
        this.error = null
        this.resetPlayer()

        const arrayBuffer = audioUrl.endsWith('.pcm')
          ? await this.loadPcmAudio(audioUrl)
          : await this.loadRegularAudio(audioUrl)

        await this.loadAudio(arrayBuffer)
      } catch (err) {
        console.error('加载音频失败:', err)
        this.error = '加载音频失败: ' + err.message
      } finally {
        this.loading = false
      }
    },

    async loadPcmAudio(url) {
      try {
        const response = await fetch(url, {
          headers: {
            'X-Mintti-Web-Token': Vue.ls.get(ACCESS_TOKEN),
          },
        })
        if (!response.ok) throw new Error('HTTP错误: ' + response.status)

        const pcmData = await response.arrayBuffer()
        return this.convertPcmToWav(pcmData)
      } catch (err) {
        console.error('PCM转换失败:', err)
        throw new Error('PCM音频处理失败')
      }
    },

    async loadRegularAudio(url) {
      try {
        const response = await axios({
          method: 'get',
          url,
          responseType: 'arraybuffer',
          timeout: 10000,
        })
        return response.data
      } catch (err) {
        console.error('音频下载失败:', err)
        throw new Error('音频下载失败')
      }
    },

    async loadAudio(arrayBuffer) {
      return new Promise((resolve, reject) => {
        try {
          if (this.audioBlobUrl) {
            URL.revokeObjectURL(this.audioBlobUrl)
          }

          const blob = new Blob([arrayBuffer], { type: 'audio/wav' })
          this.audioBlobUrl = URL.createObjectURL(blob)
          this.$refs.audioPlayer.src = this.audioBlobUrl

          this.wavesurfer
            .loadBlob(blob)
            .then(() => {
              console.log('音频加载完成')
              resolve()
            })
            .catch((err) => {
              console.error('WaveSurfer加载失败:', err)
              reject(new Error('音频解析失败'))
            })
        } catch (err) {
          reject(err)
        }
      })
    },

    resetPlayer() {
      if (this.isPlaying) {
        this.stopPlay()
      }
      if (this.$refs.audioPlayer) {
        this.$refs.audioPlayer.src = ''
      }
    },

    cleanup() {
      if (this.audioBlobUrl) {
        URL.revokeObjectURL(this.audioBlobUrl)
      }
      if (this.wavesurfer) {
        this.wavesurfer.destroy()
      }
    },

    startPlay() {
      if (this.wavesurfer) {
        this.isPlaying = true
        this.wavesurfer.play()
      }
    },

    stopPlay() {
      if (this.wavesurfer) {
        this.isPlaying = false
        this.wavesurfer.pause()
      }
    },

    handleSeek() {
      if (this.wavesurfer && this.$refs.audioPlayer) {
        const currentTime = this.$refs.audioPlayer.currentTime
        const duration = this.$refs.audioPlayer.duration
        if (duration > 0) {
          this.wavesurfer.seekTo(currentTime / duration)
        }
      }
    },

    convertPcmToWav(pcmData) {
      const sampleRate = 8000 // 使用标准采样率
      const numChannels = 1
      const bitsPerSample = 16
      const byteRate = (sampleRate * numChannels * bitsPerSample) / 8
      const blockAlign = (numChannels * bitsPerSample) / 8
      const dataLength = pcmData.byteLength

      const buffer = new ArrayBuffer(44 + dataLength)
      const view = new DataView(buffer)

      // WAV头部
      this.writeString(view, 0, 'RIFF')
      view.setUint32(4, 36 + dataLength, true)
      this.writeString(view, 8, 'WAVE')
      this.writeString(view, 12, 'fmt ')
      view.setUint32(16, 16, true)
      view.setUint16(20, 1, true) // PCM格式
      view.setUint16(22, numChannels, true)
      view.setUint32(24, sampleRate, true)
      view.setUint32(28, byteRate, true)
      view.setUint16(32, blockAlign, true)
      view.setUint16(34, bitsPerSample, true)
      this.writeString(view, 36, 'data')
      view.setUint32(40, dataLength, true)

      // 填充PCM数据
      const pcmView = new Uint8Array(pcmData)
      const wavView = new Uint8Array(buffer, 44)
      wavView.set(pcmView)

      return buffer
    },

    writeString(view, offset, string) {
      for (let i = 0; i < string.length; i++) {
        view.setUint8(offset + i, string.charCodeAt(i))
      }
    },
  },
}
</script>

<style scoped>
.audio-visualizer-container {
  position: relative;
  width: 100%;
  height: 100%;
  display: flex;
  flex-direction: column;
}

.visualization-container {
  position: relative;
  flex: 1;
  display: flex;
  flex-direction: column;
  background-color: #f5f5f5;
  border-radius: 4px;
  overflow: hidden;
}

.waveform,
.spectrogram {
  width: 100%;
  height: 150px;
  background-color: #fff;
  border-radius: 4px;
  box-shadow: 0 2px 4px rgba(0, 0, 0, 0.1);
}

.loading-indicator,
.error-message {
  position: absolute;
  top: 50%;
  left: 50%;
  transform: translate(-50%, -50%);
  padding: 10px 20px;
  background-color: rgba(0, 0, 0, 0.7);
  color: white;
  border-radius: 4px;
  z-index: 10;
  font-size: 16px;
  text-align: center;
}

.error-message {
  background-color: rgba(255, 0, 0, 0.7);
}

.audio-controls {
  margin-top: 10px;
}

audio {
  width: 100%;
}
</style>
改进版:
- 显示加载进度;
- 先加载pcm文件,然后绘制波形图,再绘制频谱图;
- 代码更健壮,确保数据有效性;
<template>
  <div class="audio-visualizer-container">
    <div class="visualization-container">
      <div ref="waveform" class="waveform"></div>
      <div ref="spectrogram" class="spectrogram"></div>
      <div v-if="loading" class="loading-indicator">
        音频加载中... {{ progress }}%
        <div class="progress-bar">
          <div class="progress-fill" :style="{ width: progress + '%' }"></div>
        </div>
      </div>
      <div v-if="error" class="error-message">{{ error }}</div>
    </div>

    <div class="audio-controls">
      <audio
        ref="audioPlayer"
        controls
        @play="startPlay"
        @pause="stopPlay"
        @seeked="handleSeek"
        controlsList="nodownload noplaybackrate"
      ></audio>
    </div>
  </div>
</template>

<script>
import axios from 'axios'
import Vue from 'vue'
import { ACCESS_TOKEN } from '@/store/mutation-types'
import WaveSurfer from 'wavesurfer.js'
import Spectrogram from 'wavesurfer.js/dist/plugins/spectrogram.esm.js'

export default {
  name: 'AudioWaveform',
  props: {
    audioUrl: {
      type: String,
      required: true,
    },
  },
  data() {
    return {
      wavesurfer: null,
      spectrogramPlugin: null,
      isPlaying: false,
      audioBlobUrl: null,
      loading: false,
      error: null,
      isUserInteraction: false,
      progress: 0, // 新增加载进度百分比
      // 新增:请求控制器
      currentRequestController: null,
    }
  },
  watch: {
    audioUrl(newVal) {
      this.handleAudioUrl(newVal)
    },
  },
  mounted() {
    this.initWaveSurfer()
    this.handleAudioUrl(this.audioUrl)
  },
  beforeDestroy() {
    this.cleanup()
  },
  methods: {
    async initWaveSurfer() {
      // 销毁旧实例
      if (this.wavesurfer) {
        this.wavesurfer.destroy()
        this.wavesurfer = null
      }

      // 创建新的 WaveSurfer 实例
      this.wavesurfer = WaveSurfer.create({
        container: this.$refs.waveform,
        waveColor: '#48a1e0',
        progressColor: '#25ebd7',
        cursorColor: '#333',
        height: 150,
        sampleRate: 8000,
      })

      // 创建并注册频谱图插件
      const spectrogramPlugin = Spectrogram.create({
        container: this.$refs.spectrogram,
        height: 150,
        fftSamples: 1024,
        frequencyMax: 8000,
        frequencyMin: 0,
        colorMap: 'roseus',
        windowFunc: 'hann',
        alpha: 1,
      })

      await this.wavesurfer.registerPlugin(spectrogramPlugin)

      // 绑定事件
      this.wavesurfer.on('ready', () => {
        console.log('WaveSurfer 和 Spectrogram 加载完成')
      })

      this.wavesurfer.on('error', (err) => {
        console.error('WaveSurfer error:', err)
        this.error = '音频处理错误: ' + err
      })

      // 监听用户交互事件
      this.wavesurfer.on('interaction', () => {
        this.isUserInteraction = true
      })

      // 监听波形图进度变化
      this.wavesurfer.on('timeupdate', (currentTime) => {
        if (this.isUserInteraction) {
          this.$refs.audioPlayer.currentTime = currentTime
          this.isUserInteraction = false // 重置标志
        }
      })
    },

    calcRealMv(point) {
      return (point * 3.3) / 32767
    },

    async handleAudioUrl(audioUrl) {
      if (!audioUrl) return

      try {
        // 1. 中止之前的请求
        if (this.currentRequestController) {
          this.currentRequestController.abort()
        }

        // 2. 创建新的控制器
        const controller = new AbortController()
        this.currentRequestController = controller

        // 3. 重置状态
        this.resetComponentState()

        // 4. 初始化 WaveSurfer
        await this.initWaveSurfer()

        this.loading = true
        this.progress = 0
        this.error = null

        // 5. 加载音频
        const arrayBuffer = audioUrl.endsWith('.pcm')
          ? await this.loadPcmAudio(audioUrl, controller)
          : await this.loadRegularAudio(audioUrl, controller)

        await this.loadAudio(arrayBuffer)
      } catch (err) {
        if (err.name === 'AbortError') {
          console.log('请求已中止')
          return
        }
        console.error('加载音频失败:', err)
        this.error = '加载音频失败: ' + err.message
      } finally {
        this.loading = false
      }
    },

    async loadPcmAudio(url) {
      try {
        const response = await fetch(url, {
          headers: {
            'X-Mintti-Web-Token': Vue.ls.get(ACCESS_TOKEN),
          },
        })
        if (!response.ok) throw new Error('HTTP错误: ' + response.status)

        const pcmBlob = await response.blob()

        return new Promise((resolve, reject) => {
          const reader = new FileReader()
          reader.onload = () => resolve(reader.result)
          reader.onerror = () => reject(new Error('读取PCM失败'))
          reader.readAsArrayBuffer(pcmBlob)
        })
      } catch (err) {
        console.error('PCM转换失败:', err)
        throw new Error('PCM音频处理失败')
      }
    },

    async loadRegularAudio(url, controller) {
      try {
        const response = await axios({
          method: 'get',
          url,
          responseType: 'arraybuffer',
          timeout: 60000,
          signal: controller.signal,
          onDownloadProgress: (progressEvent) => {
            this.progress = Math.round((progressEvent.loaded * 100) / progressEvent.total)
          },
        })
        return response.data
      } catch (err) {
        if (err.name === 'AbortError') {
          throw err
        }
        console.error('音频下载失败:', err)
        throw new Error('音频下载失败')
      }
    },
    async loadPcmAudio(url, controller) {
      try {
        const response = await fetch(url, {
          headers: {
            'X-Mintti-Web-Token': Vue.ls.get(ACCESS_TOKEN),
          },
          signal: controller.signal,
        })

        if (!response.ok) throw new Error('HTTP错误: ' + response.status)

        const pcmBlob = await response.blob()

        return new Promise((resolve, reject) => {
          const reader = new FileReader()
          reader.onload = () => resolve(reader.result)
          reader.onerror = () => reject(new Error('读取PCM失败'))
          reader.readAsArrayBuffer(pcmBlob)
        })
      } catch (err) {
        if (err.name === 'AbortError') {
          throw err
        }
        console.error('PCM转换失败:', err)
        throw new Error('PCM音频处理失败')
      }
    },

    async loadAudio(arrayBuffer) {
      return new Promise((resolve, reject) => {
        try {
          if (this.audioBlobUrl) {
            URL.revokeObjectURL(this.audioBlobUrl)
          }

          const blob = new Blob([arrayBuffer], { type: 'audio/wav' })
          this.audioBlobUrl = URL.createObjectURL(blob)
          this.$refs.audioPlayer.src = this.audioBlobUrl

          this.wavesurfer
            .loadBlob(blob)
            .then(() => {
              console.log('音频加载完成')
              resolve()
            })
            .catch((err) => {
              console.error('WaveSurfer加载失败:', err)
              reject(new Error('音频解析失败'))
            })
        } catch (err) {
          reject(err)
        }
      })
    },
    resetComponentState() {
      // 停止播放
      if (this.isPlaying) {
        this.stopPlay()
      }

      // 清空音频源
      if (this.$refs.audioPlayer) {
        this.$refs.audioPlayer.src = ''
      }

      // 清空波形图
      if (this.wavesurfer) {
        this.wavesurfer.empty()
      }

      // 重置状态
      this.progress = 0
      this.error = null
      this.isUserInteraction = false

      // 如果你希望每次都重新初始化 WaveSurfer(可选)
      // this.cleanup()
      // this.initWaveSurfer()
    },
    resetPlayer() {
      if (this.isPlaying) {
        this.stopPlay()
      }
      if (this.$refs.audioPlayer) {
        this.$refs.audioPlayer.src = ''
      }
    },

    cleanup() {
      if (this.audioBlobUrl) {
        URL.revokeObjectURL(this.audioBlobUrl)
      }
      if (this.wavesurfer) {
        this.wavesurfer.destroy()
      }
    },

    startPlay() {
      if (this.wavesurfer) {
        this.isPlaying = true
        this.wavesurfer.play()
      }
    },

    stopPlay() {
      if (this.wavesurfer) {
        this.isPlaying = false
        this.wavesurfer.pause()
      }
    },

    handleSeek() {
      if (this.wavesurfer && this.$refs.audioPlayer) {
        const currentTime = this.$refs.audioPlayer.currentTime
        const duration = this.$refs.audioPlayer.duration
        if (duration > 0) {
          this.wavesurfer.seekTo(currentTime / duration)
        }
      }
    },

    convertPcmToWav(pcmData) {
      const sampleRate = 8000
      const numChannels = 1
      const bitsPerSample = 16
      const byteRate = (sampleRate * numChannels * bitsPerSample) / 8
      const blockAlign = (numChannels * bitsPerSample) / 8
      const dataLength = pcmData.byteLength

      const buffer = new ArrayBuffer(44 + dataLength)
      const view = new DataView(buffer)

      this.writeString(view, 0, 'RIFF')
      view.setUint32(4, 36 + dataLength, true)
      this.writeString(view, 8, 'WAVE')
      this.writeString(view, 12, 'fmt ')
      view.setUint32(16, 16, true)
      view.setUint16(20, 1, true)
      view.setUint16(22, numChannels, true)
      view.setUint32(24, sampleRate, true)
      view.setUint32(28, byteRate, true)
      view.setUint16(32, blockAlign, true)
      view.setUint16(34, bitsPerSample, true)
      this.writeString(view, 36, 'data')
      view.setUint32(40, dataLength, true)

      const pcmView = new Uint8Array(pcmData)
      const wavView = new Uint8Array(buffer, 44)
      wavView.set(pcmView)

      return buffer
    },

    writeString(view, offset, string) {
      for (let i = 0; i < string.length; i++) {
        view.setUint8(offset + i, string.charCodeAt(i))
      }
    },
  },
}
</script>

<style>
.loading-indicator {
  position: absolute;
  top: 50%;
  left: 50%;
  transform: translate(-50%, -50%);
  color: #333;
  background: rgba(255, 255, 255, 0.9);
  padding: 10px 20px;
  border-radius: 8px;
  font-size: 14px;
  text-align: center;
}

.progress-bar {
  width: 100%;
  height: 6px;
  background: #eee;
  margin-top: 8px;
  border-radius: 3px;
  overflow: hidden;
}

.progress-fill {
  height: 100%;
  background: #48a1e0;
  transition: width 0.2s;
}

.error-message {
  color: red;
  font-size: 14px;
  padding: 10px;
  background: #ffe5e5;
  border-radius: 4px;
}
</style>


 1247
1247

 被折叠的 条评论
为什么被折叠?
被折叠的 条评论
为什么被折叠?
 到【灌水乐园】发言


