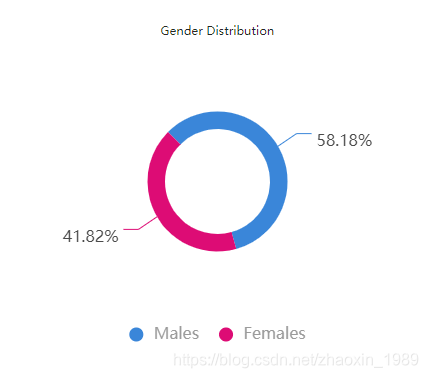
1.echarts实现好看的饼图 (pie)
2.实现代码
      this.chPie = echarts.init(document.getElementById("gender-pie-chart"));
      var nameData = ["Males", "Females"];
      var option = {
        animation: true,
        title: {
          x: "center",
          y: "center",
          textStyle: {
            color: "red",
            fontSize: 60,
            fontWeight: "normal",
            align: "center",
            width: "200px"
          },
          subtextStyle: {
            color: "red",
            fontSize: 20,
            fontWeight: "normal",
            align: "center"
          }
        },
        legend: {
          width: "50%",
          left: "center",
          textStyle: {
            color: "#9B9B9B",
            fontSize: 16
          },
          icon: "circle",
          right: "0",
          bottom: "0",
          top: "75%",
          itemGap: 20,
          data: nameData
        },
        series: [
          {
            type: "pie",
            center: ["50%", "35%"],
            radius: ["30%", "40%"],
            color: ["#3A86D9", "#DD0C75"],
            startAngle: 135,
            labelLine: {
              normal: {
                length: 25
              }
            },
            label: {
              normal: {
                // formatter: "{c}\n{d}%",
                formatter: "\n{d}%",
                backgroundColor: "rgba(255, 147, 38, 0)",
                borderColor: "transparent",
                borderRadius: 4,
                textStyle: {
                  color: "#4a4a4a",
                  fontSize: 16
                }
              }
            },
            // data: data
            data: [
              { value: 32, name: "Males" },
              { value: 23, name: "Females" }
            ]
          }
        ]
      };
      this.chPie.setOption(option);
    }


 6140
6140

 被折叠的 条评论
为什么被折叠?
被折叠的 条评论
为什么被折叠?
 到【灌水乐园】发言


