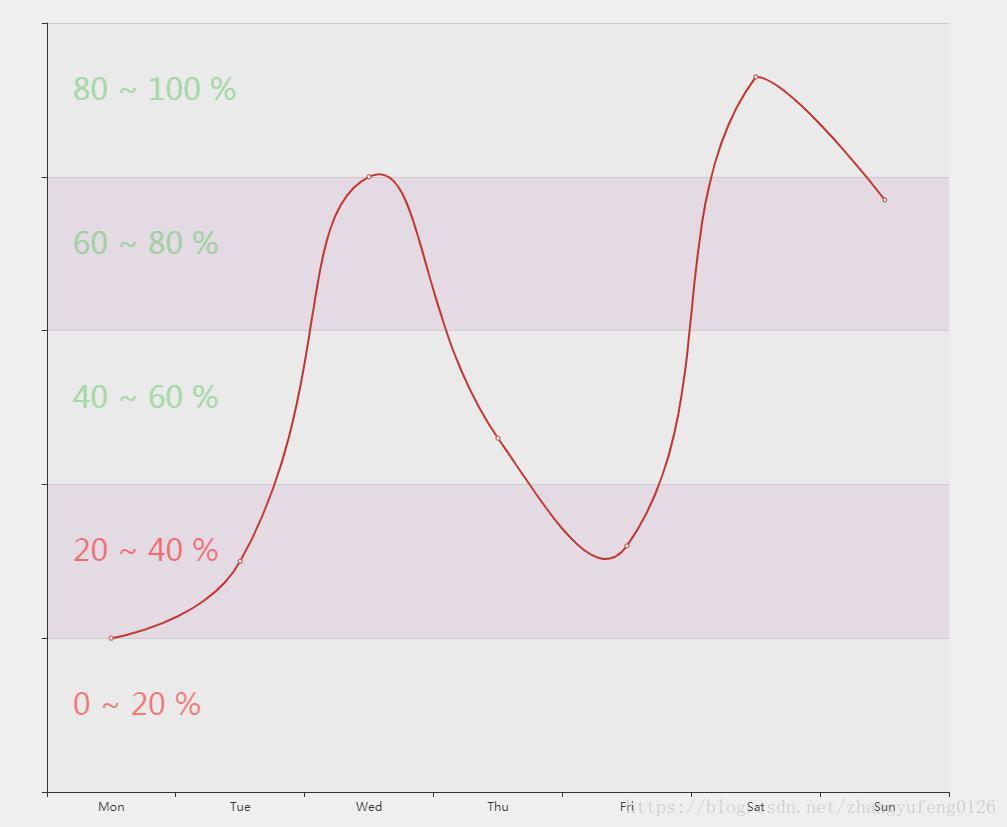
Echarts将Y轴展示成阶段数据
option = {
    xAxis: {
        type: 'category',
        data: ['Mon', 'Tue', 'Wed', 'Thu', 'Fri', 'Sat', 'Sun']
    },
    yAxis: {
        type: 'value',
        axisLabel: {
            inside: true,
            verticalAlign: "top",
            margin: 20,
            fontSize: 30,
            padding: [50, 4, 5, 6],
            formatter: function(value, index) {
                if (index === 0) {
                    return "";
                }
                var result = value * (index - 1) / index + ' ~ ' + value + ' %';
                return result;
            },
            textStyle: {
                color: function(value, index) {
                    return value >= 60 ? 'RGBA(100,200,100,0.5)' : 'RGBA(255,0,0,0.5)';
                }
            }

        },
        splitArea: {
            show: true,
            areaStyle: {
                color: [
                    'rgba(230,230,230,0.6)',
                    'rgba(200,170,200,0.3)'
                ]
            }
        }
    },
    series: [{
        data: [20, 30, 80, 46, 32, 93, 77],
        type: 'line',
        smooth: true
    }]
};


 本文介绍如何使用Echarts将Y轴数据展示为阶段形式,通过自定义formatter函数实现数据转换,同时调整样式和颜色以增强数据可视化效果。


 1165
1165

 被折叠的 条评论
为什么被折叠?
被折叠的 条评论
为什么被折叠?
 到【灌水乐园】发言


