


 本文深入探讨了Numpy库中的关键函数,包括读取矩阵文件、算术平均值、加权平均值、最值、中位数、标准差、星期数据处理、一维卷积、移动平均线等,通过实例代码展示了这些函数的应用场景和技术细节。
Numpy的常用函数
1.读取矩阵文件
xxx,xxx,xxx,xxx
xxx,xxx,xxx,xxx
xxx,xxx,xxx,xxx
由若干行若干列的数据项组成,每行数据的项数必须相等,每列数据项的类型必须相同,而且数据项之间
有明确的分隔符。

np.loadtxt(文件路径,delimiter=分隔符字符串,
           usecols=选择列集,
           unpack=是否按列展开(缺省False),
		    dtype=目标类型(缺省float),
		    converters=转换器字典)->
		    一个二维(unpack=False)或多个一维数组(unpack=True)
代码:
# -*- coding: utf-8 -*-
from __future__ import unicode_literals
import datetime as dt
import numpy as np
import matplotlib.pyplot as mp
import matplotlib.dates as md

# 将日-月-年格式的日期变为年-月-日格式的转换器函数
def dmy2ymd(dmy):
    # 将UTF-8编码的字节串转换为UCS-4编码字符串
    dmy = str(dmy, encoding='utf-8')
    '''
    d, m, y = dmy.split('-')
    ymd = y + "-" + m + "-" + d
    '''
    # 将日-月-年格式的日期字符串解析为datetime
    # 类型的对象,再取其date类型的日期子对象
    date = dt.datetime.strptime(
        dmy, '%d-%m-%Y').date()
    # 将date类型的日期对象格式
    # 化为年-月-日形式的字符串
    ymd = date.strftime('%Y-%m-%d')
    return ymd
    # 从aapl.csv文件中读取苹果公司一段时间内的
    # 股票价格:开盘价,最高价,最低价和收盘价
    dates, opening_prices, highest_prices, \
    lowest_prices, closing_prices = np.loadtxt(
        '../../data/aapl.csv', delimiter=",",
        usecols=(1, 3, 4, 5, 6), unpack=True,
        dtype='M8[D], f8, f8, f8, f8',
        converters={1: dmy2ymd})
    mp.figure('Candlestick', facecolor='lightgray')
    mp.title('Candlestick', fontsize=20)
    mp.xlabel('Date', fontsize=14)
    mp.ylabel('Price', fontsize=14)
    ax = mp.gca()
    # 主刻度表示每个星期的星期一
    ax.xaxis.set_major_locator(
    md.WeekdayLocator(byweekday=md.MO))
    # 次刻度表示每一天
    ax.xaxis.set_minor_locator(md.DayLocator())
    # 设置主刻度的标签格式:日 月(英文缩写) 年
    ax.xaxis.set_major_formatter
    md.DateFormatter('%d %b %Y'))
    mp.tick_params(labelsize=10)
    mp.grid(axis='y', linestyle=':')
    # Numpy.datetime64[D]->
    #     Matplotlib.dates.datetime.datetime
    dates = dates.astype(md.datetime.datetime)
    rise = closing_prices - opening_prices >= 0.01
    fall = opening_prices - closing_prices >= 0.01
    fc = np.zeros(dates.size, dtype='3f4')
    ec = np.zeros(dates.size, dtype='3f4')
    fc[rise], fc[fall] = (1, 1, 1), (0, 0.5, 0)
    ec[rise], ec[fall] = (1, 0, 0), (0, 0.5, 0)
    mp.bar(dates, highest_prices - lowest_prices,
           0, lowest_prices, color=fc, edgecolor=ec)
    mp.bar(dates, closing_prices - opening_prices,
           0.8, opening_prices, color=fc, edgecolor=ec)
    mp.gcf().autofmt_xdate()
    mp.show()
mask掩码数组
2.算术平均值
样本:S = [s1, s2, ..., sn]
算术平均值:m = (s1+s2+...+sn)/n
s1 = s + d1
s2 = s + d2
...
sn = s + dn
m = s + (d1+d2+...+dn)/n
n->oo: (d1+d2+...+dn)/n->0
算术平均值就是当样本数足够的条件下对真值得无偏估计。
np.mean(样本数组)->算术平均值
样本数组.mean()->算术平均值
代码:
# -*- coding: utf-8 -*-
from __future__ import unicode_literals
import numpy as np
closing_prices = np.loadtxt(
    '/home/tarena/aapl.csv', delimiter=',',
    usecols=(3, 6), unpack=True)
mean = 0
for closing_price in closing_prices:
    mean += closing_price
mean /= closing_prices.size
print(mean)
mean = np.mean(closing_prices)
print(mean)
mean = closing_prices.mean()
print(mean)
3.加权平均值
样本:S = [s1, s2, ..., sn]
权重:W = [w1, w2, ..., wn]
加权平均值:
a = (s1w1+s2w2+...+snwn)/(w1+w2+...+wn)
算术平均值就是权重相等的加权平均值
np.average(样本数组, weights=权重数组)
    ->加权平均值
代码:(成交量加权平均价格)
时间:早------------------>晚
价格:10 … 52 48 51 50
权重:低------------------>高
# -*- coding: utf-8 -*-
from __future__ import unicode_literals
import numpy as np
closing_prices, volumes = np.loadtxt(
    '/home/tarena/aapl.csv', delimiter=',',
    usecols=(6, 7), unpack=True)
vwap, wsum = 0, 0
for closing_price, volume in zip(
        closing_prices, volumes):
    vwap += closing_price * volume
    wsum += volume
vwap /= wsum
print(vwap)
vwap = np.average(closing_prices, weights=volumes)
print(vwap)
代码:(时间加权平均价格)
# -*- coding: utf-8 -*-
from __future__ import unicode_literals
import datetime as dt
import numpy as np

def dmy2days(dmy):
    dmy = str(dmy, encoding='utf-8')
    date = dt.datetime.strptime(dmy, '%d-%m-%Y').date()
    days = (date - dt.date.min).days
    return days

days, closing_prices = np.loadtxt(
    '/home/tarena/aapl.csv', delimiter=',',
    usecols=(1, 6), unpack=True,
    converters={1: dmy2days})
twap, wsum = 0, 0
for closing_price, day in zip(
        closing_prices, days):
    twap += closing_price * day
    wsum += day
twap /= wsum
print(twap)
twap = np.average(closing_prices, weights=days)
print(twap)
4.最值
np.max()    在一个数组中求最大值或最小值元素
np.min()
np.argmax()    在一个数组中求最大值或最小值下标
np.argmin()
np.maximum()    把两个数组中对应位置的最大值或最小值收集到一个新的数组中
np.minimum()
np.ptp() - 一个数组的极差――最大元素与最小元素之差
代码:
# -*- coding: utf-8 -*-
from __future__ import unicode_literals
import numpy as np
# 产生9个位于[10, 100)区间的服从均匀分布的随机数
a = np.random.randint(10, 100, 9).reshape(3, 3)
print(a)
'''
  [[60 48 57]
  [37 91 66]
  [19 46 35]]
'''
b, c = np.max(a), np.min(a)
print(b, c)  # 91 19
d, e = np.argmax(a), np.argmin(a)
print(d, e)  # 4 6
names = np.array(['zhangfei', 'zhaoyun', 'guanyu'])
scores = np.array([70, 90, 80])
print(names[np.argmax(scores)])  # zhaoyun

 = np.random.randint(10, 100, 9).reshape(3, 3)
print(f)
'''
  [[94 83 38]
   [65 28 32]
   [45 59 10]]
'''
g, h = np.maximum(a, f), np.minimum(a, f)
print(g, h, sep='\n')
'''
  [[94 83 57]
   [65 91 66]
   [45 59 35]]
'''
i = np.ptp(a)
print(i)
'''
  [[60 48 38]
   [37 28 32]
   [19 46 10]]
'''
价格波动范围
代码:
# -*- coding: utf-8 -*-
from __future__ import unicode_literals
import numpy as np
highest_prices, lowest_prices = np.loadtxt(
    '/home/tarena/aapl.csv', delimiter=',',
    usecols=(4, 5), unpack=True)
max_highest_price, min_lowest_price = highest_prices[0], lowest_prices[0]
for highest_price, lowest_price in zip(
        highest_prices[1:], lowest_prices[1:]):
    if max_highest_price < highest_price:
        max_highest_price = highest_price
    if min_lowest_price > lowest_price:
        min_lowest_price = lowest_price
print(max_highest_price - min_lowest_price)
print(np.max(highest_prices) - np.min(lowest_prices))
价格波动幅度
代码:
# -*- coding: utf-8 -*-
from __future__ import unicode_literals
import numpy as np
highest_prices, lowest_prices = np.loadtxt(
    '/home/tarena/aapl.csv', delimiter=',',
    usecols=(4, 5), unpack=True)
max_highest_price, min_highest_price, \
    max_lowest_price, min_lowest_price = \
    highest_prices[0], highest_prices[0], \
    lowest_prices[0], lowest_prices[0]
for highest_price, lowest_price in zip(
        highest_prices[1:], lowest_prices[1:]):
    if max_highest_price < highest_price:
        max_highest_price = highest_price
    if min_highest_price > highest_price:
        min_highest_price = highest_price
    if max_lowest_price < lowest_price:
        max_lowest_price = lowest_price
    if min_lowest_price > lowest_price:
        min_lowest_price = lowest_price
print(max_highest_price - min_highest_price,
      max_lowest_price - min_lowest_price)
print(np.ptp(highest_prices), np.ptp(lowest_prices))
5.中位数
5000 3000 4000 6000 1 10000000000
1 3000 4000 5000 6000 10000000000
         \____/
            |
          4500
(a[(6-1)/2] + a[6/2]) / 2
1 3000 4000 5000 10000000000
        |
       4000
(a[(5-1)/2] + a[5/2]) / 2
通用公式:(a[(L-1)/2] + a[L/2]) / 2
np.median(数组)->中位数
代码:
# -*- coding: utf-8 -*-
from __future__ import unicode_literals
import numpy as np
closing_prices = np.loadtxt(
    '/home/tarena/aapl.csv', delimiter=',',
    usecols=(6, 7), unpack=True)
sorted_prices = np.msort(closing_prices)
l = len(sorted_prices)
median = (sorted_prices[int((l - 1) / 2)] +
          sorted_prices[int(l / 2)]) / 2
print(median)
median = np.median(closing_prices)
print(median)
6.标准差
样本:S = [s1, s2, ..., sn]
均值:m = (s1+s2+...+sn)/n -> 真值
离差:D = [d1, d2, ..., dn], di = si - m
离差方:Q = [q1, q2, ..., qn], qi = di^2
(总体)方差:v = (q1+q2+...+qn)/n
(总体)标准差:std = sqrt(v) -> 方均根误差,表示所有样本相对于真值的偏离程度。将其作为表征
一组随机量分散性的指标
(样本)方差:v' = (q1+q2+...+qn)/(n-1)
(样本)标准差:std' = sqrt(v')
np.std(样本数组, ddof=非自由度(缺省0))->标准差
代码:
# -*- coding: utf-8 -*-
from __future__ import unicode_literals
import numpy as np
closing_prices = np.loadtxt(
    '/home/tarena/aapl.csv', delimiter=',',
    usecols=(6), unpack=True)
# 均值
mean = closing_prices.mean()
# 离差
devs = closing_prices - mean
# 总体方差
pvar = (devs ** 2).sum() / devs.size
# 总体标准差
pstd = np.sqrt(pvar)
# 样本方差
svar = (devs ** 2).sum() / (devs.size - 1)
# 样本标准差
sstd = np.sqrt(svar)
print(pstd, sstd)
pstd = np.std(closing_prices)
sstd = np.std(closing_prices, ddof=1)
print(pstd, sstd)
7.星期数据
 Mon  Tue  Wed   Thu   Fri
 xxx  xxx  xxx   xxx  xxx
 xxx  xxx  xxx   xxx  xxx
...
np.where(条件) -> 数组中满足该条件的元素的下标数组
np.take(数组, 下标数组) -> 数组中与下标数组相对应的元素所构成的子数组
数组[掩码数组] -> 数组中与掩码数组为True的元素相对应的元素所构成的子数组
计算星期均值
代码:
# -*- coding: utf-8 -*-
from __future__ import unicode_literals
import datetime as dt
import numpy as np

def dmy2wday(dmy):
    dmy = str(dmy, encoding='utf-8')
    date = dt.datetime.strptime( dmy, '%d-%m-%Y').date()
    wday = date.weekday()  # 用0-6表示周一到周日
    return wday
wdays, closing_prices = np.loadtxt(
    '/home/tarena/aapl.csv', delimiter=',',
    usecols=(1, 6), unpack=True,
    converters={1: dmy2wday})
ave_closing_prices = np.zeros(5)

for wday in range(len(ave_closing_prices)):
    '''
    ave_closing_prices[wday] = np.take(
        closing_prices,
        np.where(wdays == wday)).mean()
    ave_closing_prices[wday] = closing_prices[
        np.where(wdays == wday)].mean()
    '''
    ave_closing_prices[wday] = closing_prices[
        wdays == wday].mean()
for wday, ave_closing_price in zip(
        ['MON', 'TUE', 'WED', 'THU', 'FRI'],
        ave_closing_prices):
    print(wday, np.round(ave_closing_price, 2))
np.apply_along_axis(处理函数, 轴向, 数组)
将n维数组按照给定的轴向分解为若干个n-1维子数组作为参数调用处理函数,并将其返回值重新组合成数组的形式返回
代码:
# -*- coding: utf-8 -*-
from __future__ import unicode_literals
import numpy as np

def foo(a):
    return a.sum()

b = np.apply_along_axis(foo, 0, a)
print(b)  # [12 15 18]
c = np.apply_along_axis(foo, 1, a)
print(c)  # [ 6 15 24]
统计每周的开高低收价格
代码:
# -*- coding: utf-8 -*-
from __future__ import unicode_literals
import datetime as dt
import numpy as np

def dmy2wday(dmy):
    dmy = str(dmy, encoding='utf-8')
    date = dt.datetime.strptime(
        dmy, '%d-%m-%Y').date()
    wday = date.weekday()  # 用0-6表示周一到周日
    return wday

wdays, opening_prices, highest_prices, \
    lowest_prices, closing_prices = np.loadtxt(
        '../../data/aapl.csv', delimiter=',',
        usecols=(1, 3, 4, 5, 6), unpack=True,
        converters={1: dmy2wday})
wdays = wdays[:16]
opening_prices = opening_prices[:16]
highest_prices = highest_prices[:16]
lowest_prices = lowest_prices[:16]
closing_prices = closing_prices[:16]
first_monday = np.where(wdays == 0)[0][0]
last_friday = np.where(wdays == 4)[0][-1]
indices = np.arange(first_monday, last_friday + 1)
indices = np.array(np.split(indices, 3))

def week_summary(indices):
    opening_price = opening_prices[indices[0]]
    highest_price = np.take(highest_prices, indices).max()
    lowest_price = np.take(lowest_prices, indices).min()
    closing_price = closing_prices[indices[-1]]
    return opening_price, highest_price,  lowest_price, closing_price
summaries = np.apply_along_axis(week_summary, 1, indices)
np.savetxt('../../data/summary.csv',summaries, delimiter=',', fmt='%g')
8.一维卷积
a = [1 2 3 4 5]
b = [6 7 8]
c = a @ b = [6 19 40 61 82 67 40] - 完全卷积(full)
                        [19 40 61 82 67] - 同维卷积(same)
                             [40 61 82] - 有效卷积(valid)
            6   19  40  61  82 67 40
0    0    1    2    3    4    5   0    0
8    7    6
      8    7    6
            8    7    6
                  8    7    6
                        8    7    6
                              8    7    6
                                    8    7    6
c = np.convolve(a, b, ['full']/'same'/'valid')
                             ^ ^                   ^
                              |  |____              |
                      被卷积数组 |       卷积类型
                                卷积核数组
代码:
# -*- coding: utf-8 -*-
from __future__ import unicode_literals
import numpy as np
a = np.array([1, 2, 3, 4, 5])
b = np.array([6, 7, 8])
print(np.convolve(a, b))  # [ 6 19 40 61 82 67 40]
print(np.convolve(a, b, 'same'))  # [19 40 61 82 67]
print(np.convolve(a, b, 'valid'))  # [40 61 82]
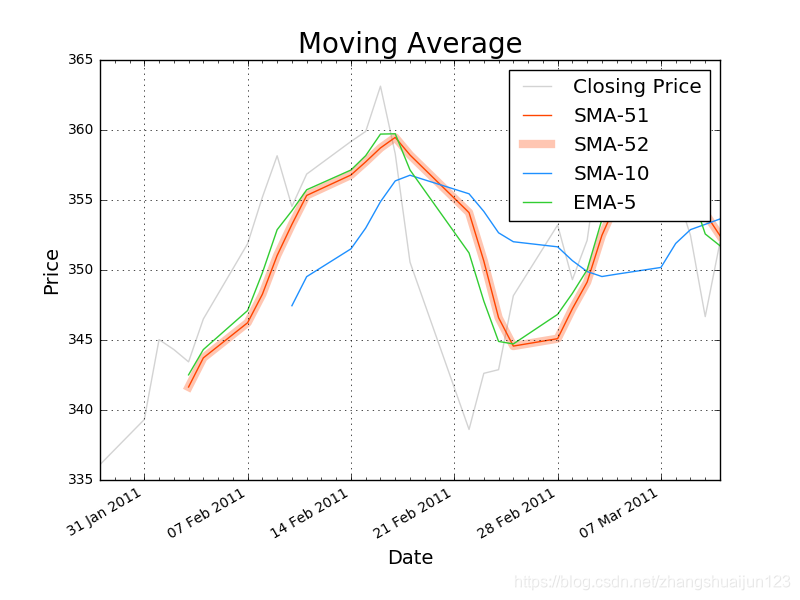
9.移动平均线
代码:
# -*- coding: utf-8 -*-
from __future__ import unicode_literals
import datetime as dt
import numpy as np
import matplotlib.pyplot as mp
import matplotlib.dates as md
# 将日-月-年格式的日期变为年-月-日格式的转换器函数


def dmy2ymd(dmy):
        # 将UTF-8编码的字节串转换为UCS-4编码字符串
    dmy = str(dmy, encoding='utf-8')
    '''
    d, m, y = dmy.split('-')
    ymd = y + "-" + m + "-" + d
    '''
    # 将日-月-年格式的日期字符串解析为datetime
    # 类型的对象,再取其date类型的日期子对象
    date = dt.datetime.strptime(
        dmy, '%d-%m-%Y').date()
    # 将date类型的日期对象格式
    # 化为年-月-日形式的字符串
    ymd = date.strftime('%Y-%m-%d')
    return ymd


# 从aapl.csv文件中读取苹果公司一段时间内的
# 股票价格:开盘价,最高价,最低价和收盘价
dates, closing_prices = np.loadtxt(
    '/home/tarena/aapl.csv', delimiter=",",
    usecols=(1, 6), unpack=True,
    dtype='M8[D], f8', converters={1: dmy2ymd})
sma51 = np.zeros(closing_prices.size - 4)
for i in range(sma51.size):
    sma51[i] = closing_prices[i:i + 5].mean()
sma52 = np.convolve(closing_prices,
                    np.ones(5) / 5, 'valid')
sma10 = np.convolve(closing_prices, np.ones(10) / 10, 'valid')

weights = np.exp(np.linspace(-1, 0, 5))
weights /= weights.sum()
ema5 = np.convolve(closing_prices,
                   weights[::-1], 'valid')
mp.figure('Moving Average', facecolor='lightgray')
mp.title('Moving Average', fontsize=20)
mp.xlabel('Date', fontsize=14)
mp.ylabel('Price', fontsize=14)
ax = mp.gca()
# 主刻度表示每个星期的星期一
ax.xaxis.set_major_locator(
    md.WeekdayLocator(byweekday=md.MO))
# 次刻度表示每一天
ax.xaxis.set_minor_locator(md.DayLocator())
# 设置主刻度的标签格式:日 月(英文缩写) 年
ax.xaxis.set_major_formatter(
    md.DateFormatter('%d %b %Y'))
mp.tick_params(labelsize=10)
mp.grid(linestyle=':')
# Numpy.datetime64[D]->
#     Matplotlib.dates.datetime.datetime
dates = dates.astype(md.datetime.datetime)
mp.plot(dates, closing_prices, c='lightgray',
        label='Closing Price')
mp.plot(dates[4:], sma51, c='orangered',
        label='SMA-51')
mp.plot(dates[4:], sma52, c='orangered', alpha=0.3,
        linewidth=6, label='SMA-52')
mp.plot(dates[9:], sma10, c='dodgerblue',
        label='SMA-10')
mp.plot(dates[4:], ema5, c='limegreen',
        label='EMA-5')
mp.legend()
mp.gcf().autofmt_xdate()
mp.show()
示例图:
a b c d e f g h i j k l m n
^^^ ^^
[1/5 1/5 1/5 1/5 1/5]
A B C D E -> S=A+B+C+D+E
(aA + bB + cC + dD +eE)/S
aA/S + bB/S +cC/S + dD/S + eE/S
[A/S B/S C/S D/S E/S]


 644
644

 被折叠的 条评论
为什么被折叠?
被折叠的 条评论
为什么被折叠?
 到【灌水乐园】发言


