 Vue项目集成百度地图及点击事件处理


 本文档介绍了如何在Vue项目中使用vue-baidu-map插件集成百度地图,并展示了如何设置默认中心点、调整缩放级别以及切换地图主题。通过监听地图上的点击事件,实现在点击坐标点时弹出窗口,点击详情则通过Vue路由进行页面间的参数传递,实现从地图详情到其他模块的跳转。
再vue中引入第三方插件-- https://www.npmjs.com/package/vue-baidu-map 一个百度地图的vue封装

上述中的内容在第三方插件的文档介绍中都有。
在具体特性模块中引入地图
:center属性:默认设置一个坐标点
对应的defaultCenter的值为
defaultCenter: {
  lng: 113.1268217112,
  lat: 27.8307991014
}
:zoom看文档啥意思
defaultZoom: 5,
:mapStyle设置地图的主题 {style:'dark'}是我需要的百度提供的主题
 <!--引入百度地图-->
                <baidu-map class="map" :center="defaultCenter" :zoom="defaultZoom" :mapStyle="{style:'dark'}">

                    <div v-for="(point,index) in points">

                        <bm-marker :position="point" @click="infoWindowOpen($event,index)">
                            <bm-info-window :show="point.show" @close="infoWindowClose($event,index)">
                                <p>
                                    <span>IP个数:</span>
                                    <span>{{point.doc_count ? point.doc_count : 0}}</span>
                                </p>

                                <p>
                                    <span>地址:</span>
                                    <span>{{point.object.ip_GeoPosition.P}}</span>
                                </p>

                                <p>
                                    <span>经纬度:</span>
                                    <span>{{point.textlng}},{{point.textlat}}</span>
                                </p>

                                <p>
                                    <a href="#" @click="jump(index)">查看详情</a>
                                </p>
                            </bm-info-window>
                            <bm-label :content="point.textdoc_count" :labelStyle="{color: 'red', fontSize : '10px'}" :offset="{width: 20, height: -10}"/>
                        </bm-marker>
                    </div>

                </baidu-map>
<template>
<div id="bigScreen">
<Row :gutter="5">
<Col span="5"> <!--第一列-->
<Row class="chart-row">
<Col span="24" class="chart-container" style="height: 280px" >
<Row class="circle-container">
<Col span="12">
<tp-ssa-echarts :allParams="circle1"></tp-ssa-echarts>
</Col>
<Col span="12">
<tp-ssa-echarts :allParams="circle2"></tp-ssa-echarts>
</Col>
</Row>
<Row class="circle-container">
<Col span="12">
<tp-ssa-echarts :allParams="circle3"></tp-ssa-echarts>
</Col>
<Col span="12">
<tp-ssa-echarts :allParams="circle4"></tp-ssa-echarts>
</Col>
</Row>
</Col>
</Row>
<Row class="chart-row">
<Col span="24" class="chart-container" style="height: 280px">
<tp-ssa-echarts :allParams="allParams1"></tp-ssa-echarts>
</Col>
</Row>
<Row class="chart-row">
<Col span="24" class="chart-container" style="height: 280px">
<tp-ssa-echarts :allParams="allParams2"></tp-ssa-echarts>
</Col>
</Row>
</Col>
<!--地图-->
<Col span="14" style="height:858px"> <!--第二列-->
<!--<div v-for="(point,index) in points" style="color: red">
{{point}}
{{index}}
</div>-->
<!--引入百度地图-->
<baidu-map class="map" :center="defaultCenter" :zoom="defaultZoom" :mapStyle="{style:'dark'}">
<div v-for="(point,index) in points">
<bm-marker :position="point" @click="infoWindowOpen($event,index)">
<bm-info-window :show="point.show" @close="infoWindowClose($event,index)">
<p>
<span>IP个数:</span>
<span>{{point.doc_count ? point.doc_count : 0}}</span>
</p>
<p>
<span>地址:</span>
<span>{{point.object.ip_GeoPosition.P}}</span>
</p>
<p>
<span>经纬度:</span>
<span>{{point.textlng}},{{point.textlat}}</span>
</p>
<p>
<a href="#" @click="jump(index)">查看详情</a>
</p>
</bm-info-window>
<bm-label :content="point.textdoc_count" :labelStyle="{color: 'red', fontSize : '10px'}" :offset="{width: 20, height: -10}"/>
</bm-marker>
</div>
</baidu-map>
<!--<baidu-map class="map" :center="defaultCenter" :zoom="defaultZoom">
<bm-point-collection :points="points" animation="BMAP_ANIMATION_BOUNCE">
</bm-point-collection>
</baidu-map>-->
</Col>
<Col span="5"> <!--第三列-->
<Row class="chart-row">
<Col span="24" class="chart-container" style="height: 200px">
<tp-ssa-echarts :allParams="allParams3"></tp-ssa-echarts>
</Col>
</Row>
<Row class="chart-row">
<Col span="24" class="chart-container" style="height: 430px">
<tp-ranking-list :allParams="rankingList"></tp-ranking-list>
</Col>
</Row>
<Row class="chart-row">
<Col span="24" class="chart-container" style="height: 210px">
<tp-ssa-echarts :allParams="allParams4"></tp-ssa-echarts>
</Col>
</Row>
</Col>
</Row>
</div>
</template>
<script>
import TpSsaEcharts from "../../../components/locale-components/tp-ssa-echarts/tp-ssa-echarts";
import TpRankingList from "../../../components/locale-components/tp-ssa-echarts/tp-ranking-list";
export default {
name: "countPandect",
components: {TpRankingList, TpSsaEcharts},
data() {
return {
barRefs: '',
msg: '外网资产管家页面',
timeout: 0,
circle1: {
id: 'siteSum',
type: "circle",
title: "总网站",
url: '/api/ass_loophole/loophole/static_count',
data: {
offline_attr: '_ass_loophole_static_count'
},
callback : data => {
data.total = data.rows[0].webSiteAllCnt
}
},
circle2: {
id: 'loopholeSum',
type: "circle",
title: "总漏洞数",
url: '/api/ass_loophole/loophole/static_count',
data: {
offline_attr: '_ass_loophole_static_count'
},
callback : data => {
data.total = data.rows[0].loopholeAllCnt
}
},
circle3: {
id: 'siteNoRecord',
type: "circle",
title: "未备案网站",
url: '/api/ass_loophole/loophole/static_count',
data: {
offline_attr: '_ass_loophole_static_count'
},
callback : data => {
data.total = data.rows[0].illegalCnt
}
},
circle4: {
id: 'highLoophole',
type: "circle",
title: "严重漏洞",
url: '/api/ass_loophole/loophole/static_count',
data: {
offline_attr: '_ass_loophole_static_count'
},
callback : data => {
data.total = data.rows[0].loopholeHighCnt
}
},
allParams1: {
id: 'portApply',
type: "bar",
title: "端口应用Top10",
url: '/api/getbar',
reload: 20000,
data: {
index: 'loophole_result',
type: 'lph_scan_result',
aggField: 'resultPort'
}
},
allParams2: {
id: 'ipSiteCount',
type: "bar",
title: "IP站点数Top10",
url: '/api/getbar',
reload: 20000,
data: {
index: 'ipweb_result',
type: 'web_info',
aggField: 'strIP'
}
},
allParams3: {
id: 'ipLoophole',
type: "bar",
title: "IP漏洞数Top10",
url: '/api/getbar',
reload: 20000,
data: {
index: 'loophole_result',
type: 'lph_scan_result',
aggField: 'resultHost',
page: 1,
size: 10
}
},
allParams4: {
config:{
series:[
{
label: {
normal: {
formatter: "{b} 分"
}
}
}
],
},
id: 'loopholeHigh',
type: "pie",
title: "漏洞严重性评分分布",
url: '/api/getpie',
reload: 20000,
data: {
index: 'loophole_result',
type: 'lph_scan_result',
aggField: 'resultSeverity',
size: 10
}
},
rankingList:{
id:'loophole',
title:'漏洞Top 10 排名',
url:'/api/getpie',
url1: '/api/ssa_table',
data: {
index: 'loophole_result',
type: 'lph_scan_result',
aggField: 'nvtName',
offline_attr: '_ass_loophole_happen',
page: 1,
size: 10
},
labelFlag:true,
countFlag:true
},
defaultCenter: {
// lng: 113.5325,
//lat: 34.6836
lng: 113.1268217112,
lat: 27.8307991014
},
defaultZoom: 5,
points: []
}
},
mounted () {
//直接发送请求,获取每个点的坐标位置,包括每个点需要展示的信息
let me = this;
this.$http.get('/api/ssa_topntable', {
params: {
offline_attr: '_ass_loophole_ip_position',
index: 'ipweb_result',
type: 'ip_geo_info',
aggField: 'ip_position',
showField: 'ip_position',
page: 1,
size: 100
}
}).then(function (response) {
let data = response
if (data.code === 0 && data.data.total > 0) {
let _data = data.data.rows
let points=[], mark
let dictTmp = {}
for (let i = 0; i < _data.length; i++) {
let itemDict = _data[i]._source
if (itemDict.ip_GeoPosition.D_L) {
let tmpKey = itemDict.ip_GeoPosition.D_L
if (tmpKey in dictTmp) {
dictTmp[tmpKey].doc_count += itemDict.doc_count
}
else {
dictTmp[tmpKey] = {}
//将每个点的数据拿出来,封装在新的对象中(仅需要一些要用的信息)
// lng,lat代表经纬度
//show 初始为false用来区分不同点的显示信息。
dictTmp[tmpKey].lng = itemDict.ip_GeoPosition.D_L[0]
dictTmp[tmpKey].lat = itemDict.ip_GeoPosition.D_L[1]
dictTmp[tmpKey].object = itemDict
dictTmp[tmpKey].doc_count = itemDict.doc_count
dictTmp[tmpKey].show = false;
dictTmp[tmpKey].textdoc_count = itemDict.doc_count.toString();
}
}
}
for (let tmp2Key in dictTmp) {
let earchItemDict = dictTmp[tmp2Key]
points.push(earchItemDict);
}
//points所有的点的集合。points是数组
me.points = points;
/*me.points = [{
lng: 113.5325,
lat: 34.6836
},{
lng: 110.5325,
lat: 30.6836
}];*/
/* map.centerAndZoom(point, 5)*///当然也可以根据城市名称设置地图的中心点:
// openInfoDefault(firstShow["data"], firstShow["map"]);
}
}).catch(function (error) {
alert(error);
});
},
methods: {
infoWindowOpen(event,index){
console.log(index);
let _getPosition = event.target.getPosition()
let show = this.points[index].show;
this.points[index].show = !show;
this.points[index].textlng = _getPosition.lng;
this.points[index].textlat = _getPosition.lat;
},
infoWindowClose(event,index){
this.points[index].show = false;
},
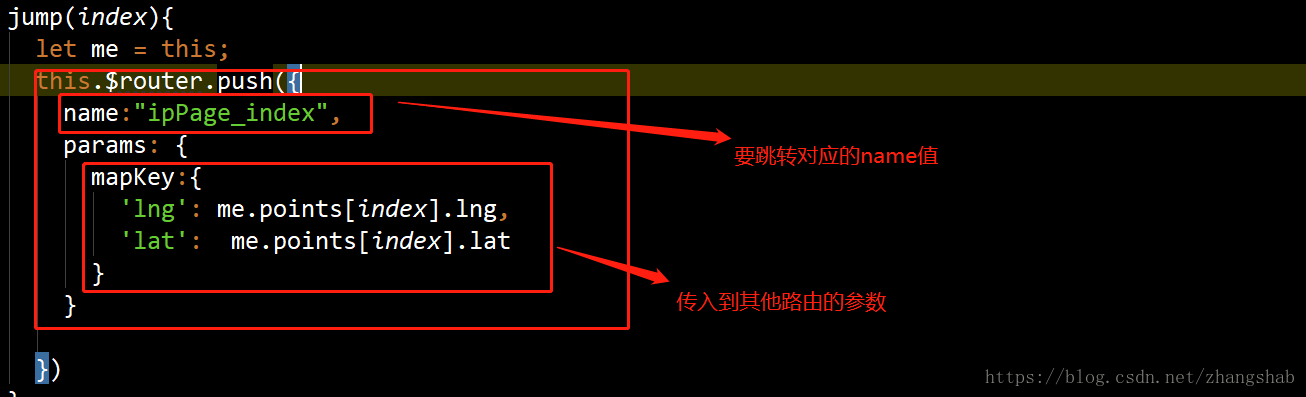
jump(index){
let me = this;
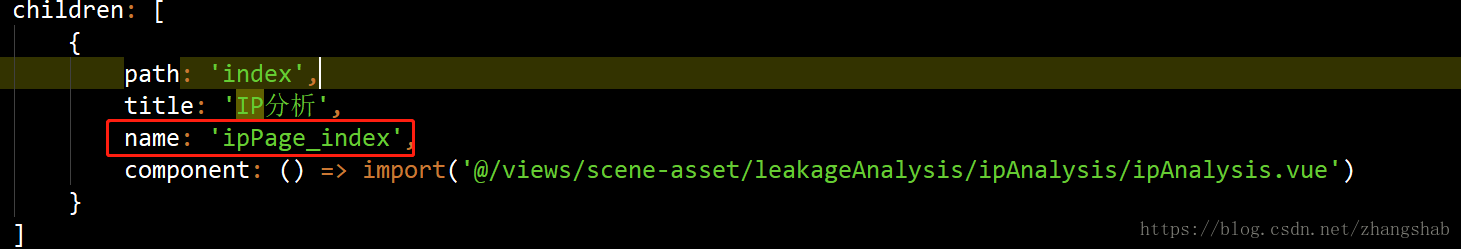
this.$router.push({
name:"ipPage_index",
params: {
mapKey:{
'lng': me.points[index].lng,
'lat': me.points[index].lat
}
}
})
}
}
};
</script>
<style lang="less" scoped>
.chart-row {
.chart-container {
margin-bottom: 6px;
margin-left: 0;
background-color: rgba(255,255,255,0.02);
}
.circle-container {
height: 50%;
.ivu-col{
height: 100%;
}
}
}
.map {
width: 100%;
height: 858px;
}
.map span{
font-size: 14px;
}
</style>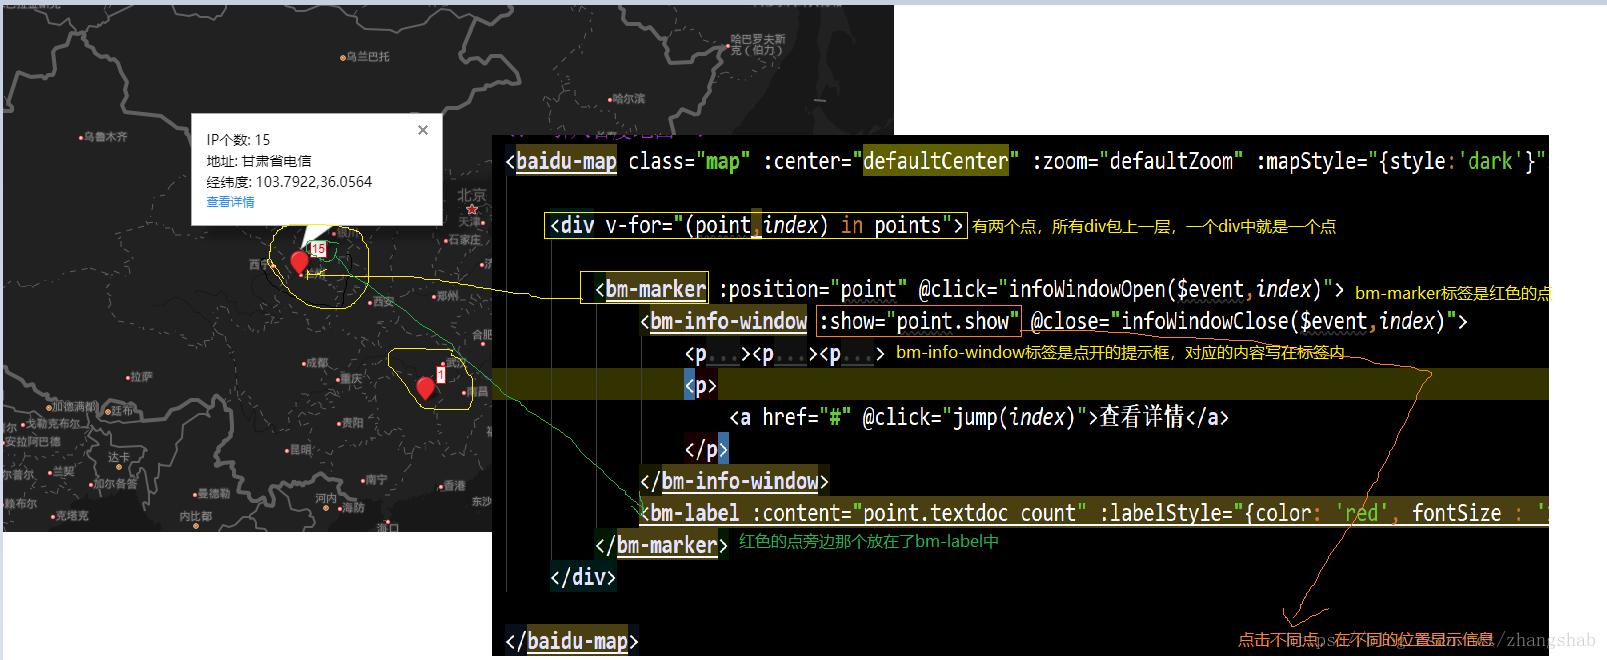
点击详情时,需要类似于超链接的路由跳转:
解决方法 加入 路由a 跳转到 路由b
路由a
this.$router.push({
name:"Show",
params: {
key:value
}
})
路由b
this.$route.params中就有a传的参数了


 被折叠的 条评论
为什么被折叠?
被折叠的 条评论
为什么被折叠?
 到【灌水乐园】发言


