


1. 引入echarts包
npm install echarts2.给页面盒子设置宽高
* {
      padding: 0;
      margin: 0;
  }

html,body {
      width: 100%;
      height: 100%;
  }

#main {
      width: 100vw;
      height: 100vh;
  }
3. 使用 registerMap 注册的地图名称。
 https://datav.aliyun.com/portal/school/atlas/area_selector#&lat=30.332329214580188&lng=106.72278672066881&zoom=3.5
 fetch('https://geo.datav.aliyun.com/areas_v3/bound/100000_full.json')
.then(res => res.json())
.then(data=>{
echarts.registerMap('china', data);
var myChart = echarts.init(document.getElementById('main'));
let option={
geo: [{
map: 'china'
}],
}
myChart.setOption(option)
}) 现在就有了一个基本的地图雏形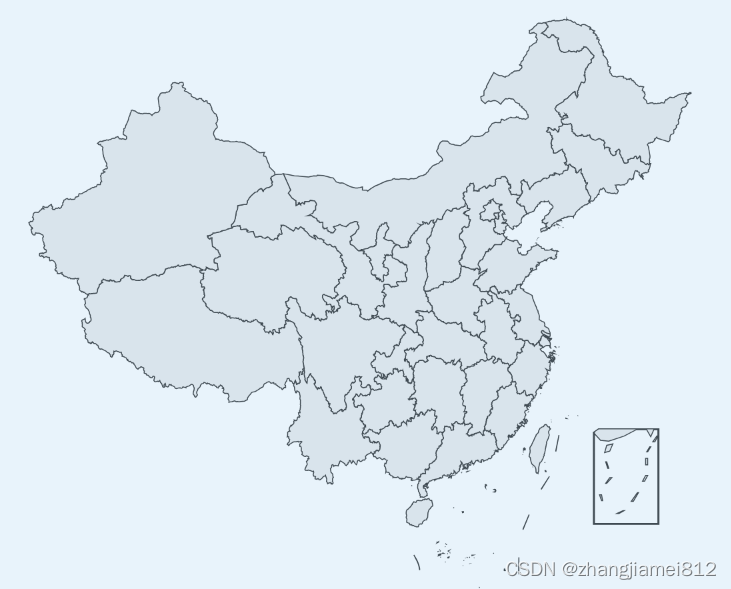
下面我们可以根据自己的需求来设置不同的样式
例1:
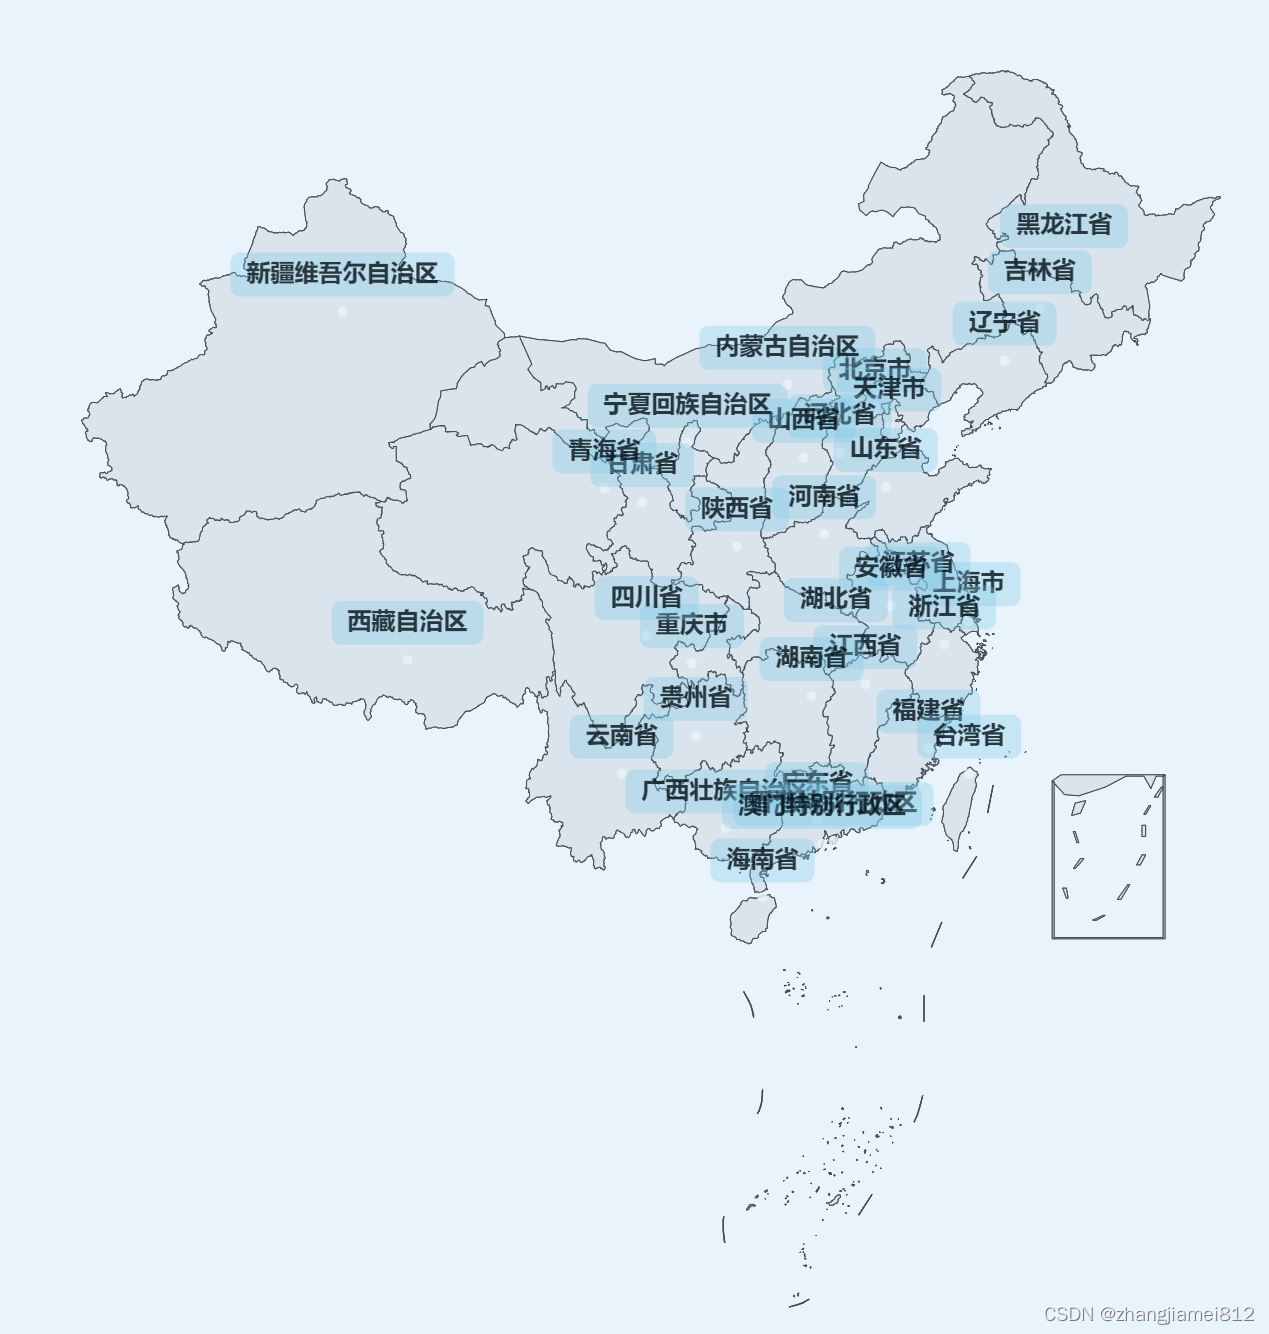
完整代码:
fetch('https://geo.datav.aliyun.com/areas_v3/bound/100000_full.json')
            .then(res => res.json())
            .then(data => {
                // console.log(data, 'data')
                echarts.registerMap('china', data);

                let center = [];
                data.features.forEach((item, index) => {
                    if (item.properties) {
                        center.push({
                            name: item.properties.name,
                            value: item.properties.center
                        })
                    }
                });
                console.log(center, 'center');

                var myChart = echarts.init(document.getElementById('main'));

                let option = {
                    geo: [{
                        map: 'china'
                    }],
                    series: [
                        {
                            type: 'map',
                            map: 'china',
                            roam: true,

                            data: center.map((item) => {
                                return {
                                    name: item.name,
                                    value: Math.random() * 100,
                                }
                            }),
                            emphasis: {
                                label: {
                                    show: false,
                                    // color: '#000',
                                    // fontWeight: "bold",
                                    // backgroundColor: 'rgba(135, 207, 235, 0.395)',
                                    // padding: [5, 8],
                                    // borderRadius: 5,
                                    // position: ['50%', '50%'],
                                }
                            }
                        },
                        {
                            type: 'scatter',
                            coordinateSystem: 'geo',
                            symbolSize: 5,
                            data: center.map(item => {
                                return {
                                    value: item.value,
                                    name: item.name
                                }
                            }),
                            label: {
                                show: true,
                                color: '#000',
                                fontWeight: "bold",
                                backgroundColor: 'rgba(135, 207, 235, 0.395)',
                                padding: [5, 8],
                                borderRadius: 5,
                                position: 'top',
                                formatter: (param) => {
                                    console.log('param', param);
                                    return param.data.name
                                },
                            },
                            itemStyle: {
                                color: '#fff',
                            },

                        }
                    ]
                }

                myChart.setOption(option)
            })
例2:
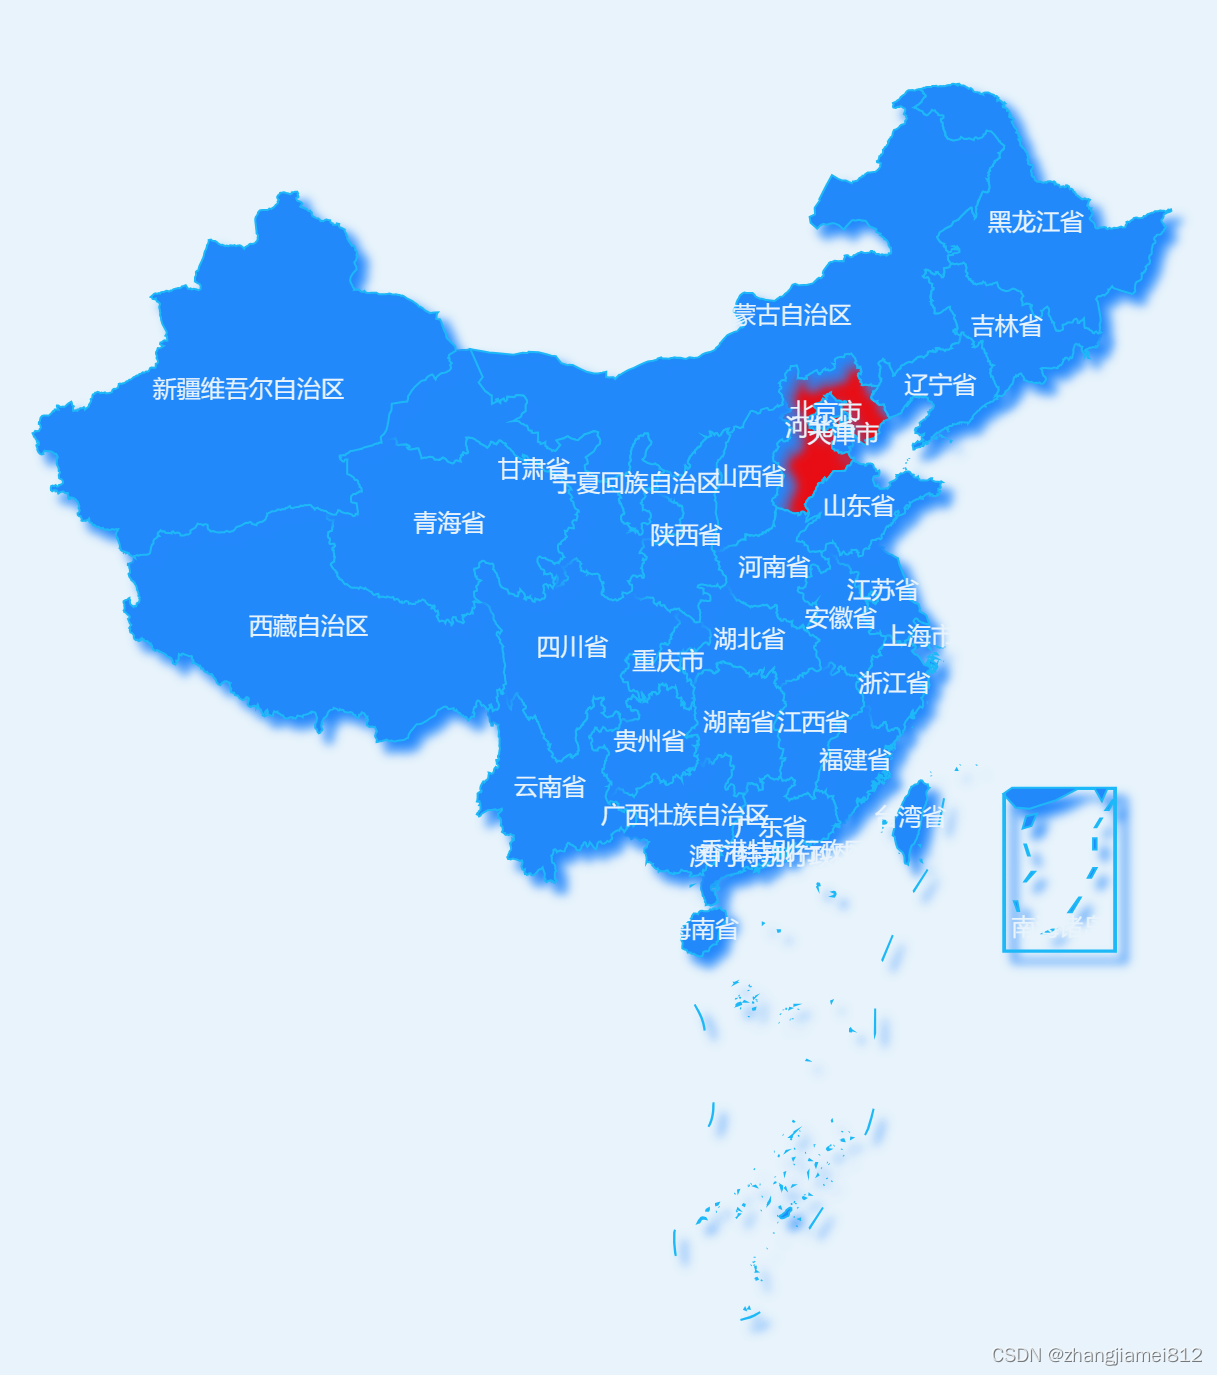
完整代码:
fetch('https://geo.datav.aliyun.com/areas_v3/bound/100000_full.json')
            .then(res => res.json())
            .then(data => {
                console.log(data, 'data')

                echarts.registerMap('china', data);
                var myChart = echarts.init(document.getElementById('main'));

                var option = {
                    geo: [{
                        map: 'china',
                        tooltip: {
                            trigger: "item",
                        },
                        // 是否开启鼠标缩放和平移漫游。默认不开启
                        roam: true,
                        // 滚轮缩放的极限控制
                        scaleLimit: {
                            min: 0.2,
                            max: 3
                        },
                        label: {
                            // 显示文字
                            show: true,
                            color: '#fff',
                        },
                        itemStyle: {
                            // 地图区域的颜色
                            areaColor: '#2389FF',
                            // 描边
                            // borderType: [5, 10],
                            // borderDashOffset: 10,
                            borderColor: 'rgb(30,190,250)',
                            borderWidth: 1,
                            // 阴影
                            shadowColor: '#2588FF',
                            shadowBlur: 5,
                            // opacity:0.2,
                            shadowOffsetX: 5,
                            shadowOffsetY: 5,
                        },
                        // 高亮状态下的多边形和标签样式
                        emphasis: {
                            itemStyle: {
                                areaColor: '#39DFFF',
                                shadowColor: '#0451A5',
                                borderColor:"#fff",
                                borderWidth:2,
                            },
                            label: {
                                color: "#fff"
                            }
                        },
                        // 在地图中对特定的区域配置样式。
                        regions: [{
                            name: '河北省',
                            itemStyle: {
                                areaColor: 'red',
                                color: 'red'
                            }
                        }]
                    }]
                }
                myChart.setOption(option)
            })
更多样式可以参考echarts官网 Apache ECharts


 832
832

 被折叠的 条评论
为什么被折叠?
被折叠的 条评论
为什么被折叠?
 到【灌水乐园】发言


