async-profiler

使用 async-profiler 进行 Java 程序性能调优 async-profiler 是一款高性能的 Java 性能分析工具,它可以用于分析 Java 应用程序的 CPU 和内存性能。通过生成火焰图(Flame Graph),async-profiler 可以直观地展示函数调用栈的性能数据,帮助开发者快速识别性能瓶颈和优化目标。async-profiler 是一款强大的 Java 性能分析工具,通过生成火焰图,可以帮助开发者直观地识别性能瓶颈和优化目标。 阅读详情

简介

async-profiler是一款采集分析java性能的工具,翻译一下github上的项目介绍:

❝

async-profiler是一款没有Safepoint bias problem的低开销java采集分析器,它利用HotSpot特殊的api来收集栈信息以及内存分配信息,可以在OpenJDK,Oracle JDK以及一些其他的基于HotSpot的java虚拟机。async-profiler可以追踪以下几种事件:

  • cpu周期
  • 硬件和软件性能计数器,例如高速缓存未命中,分支未命中,页面错误,上下文切换等
  • Java堆中内存的分配
  • 锁尝试,包括Java对象监视器和ReentrantLock

❞

使用方法

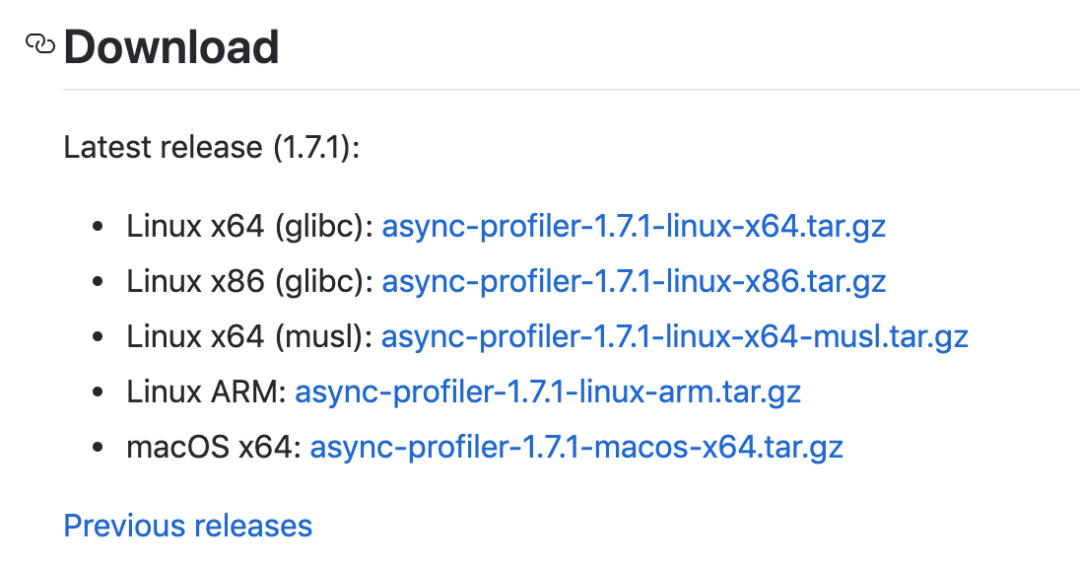
首先下载async-profiler,github主页(https://github.com/jvm-profiling-tools/async-profiler)上有已经编译好的文件,找到对应的平台下载即可

img

image

基本用法

下载好的文件解压后,有一个profiler.sh脚本,运行脚本即可对java进程进行cpu分析,例如java进程id为1232

./profiler.sh start 1232 ./profiler.sh stop 1232 

或者可以用-d指定剖析的时间(秒)

./profiler.sh -d 30 1232 

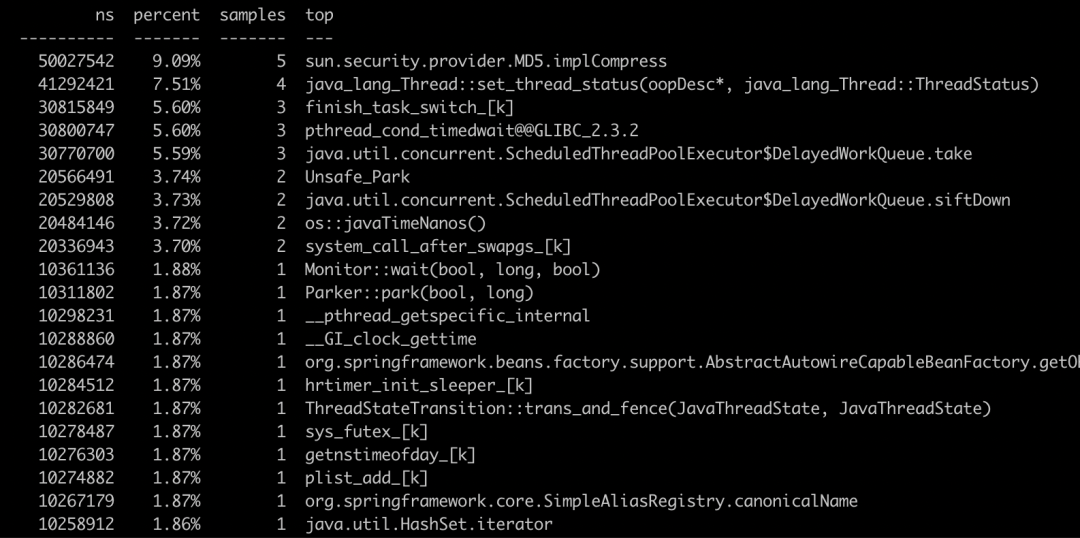
执行完成后会输出采集的信息:

img

image

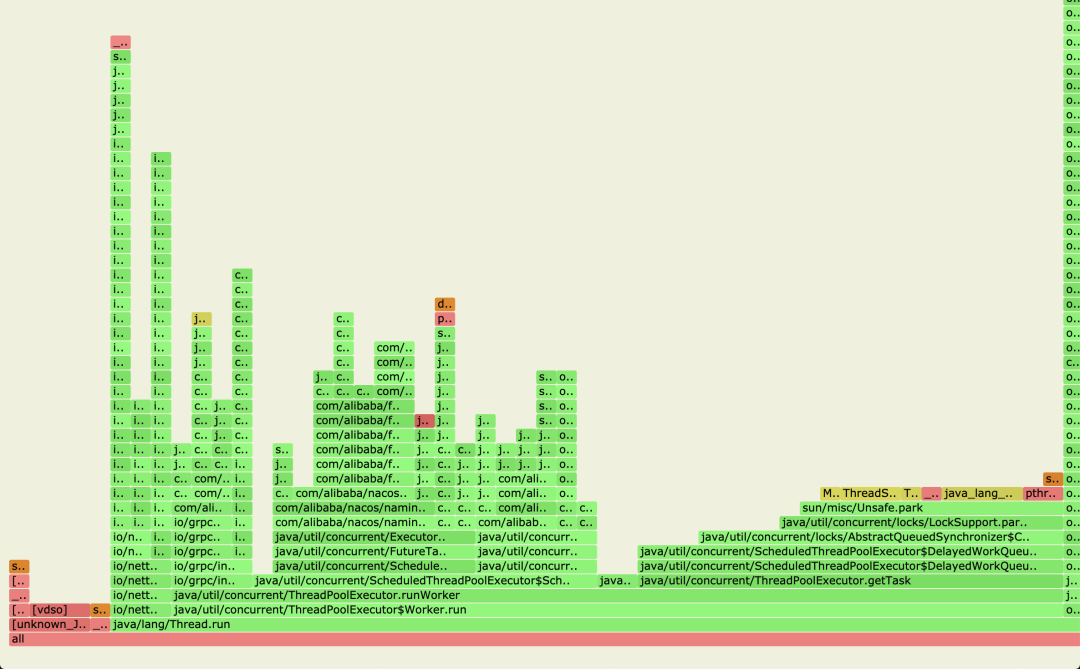
通常我们会用更加直观的火焰图来绘制输出的信息,使用参数-f {$file_name}.svg

./profiler.sh -d 30 -f ./nacos.svg 1232 

命令执行完成后会生成一个svg格式的文件,用浏览器打开

img

image

火焰图怎么看?可以参考阮一峰的文章

❝

《如何读懂火焰图》 http://www.ruanyifeng.com/blog/2017/09/flame-graph.html

❞

简单来说:x轴是抽样数,x轴越长说明被这个方法被抽样的次数越多,消耗cpu时间也越长 y轴是栈的深度,通常越往上越细,如果发现往上有一个平顶,且平顶很宽,则说明它可能有问题,消耗cpu时间较多。

其他参数介绍

  • -e event

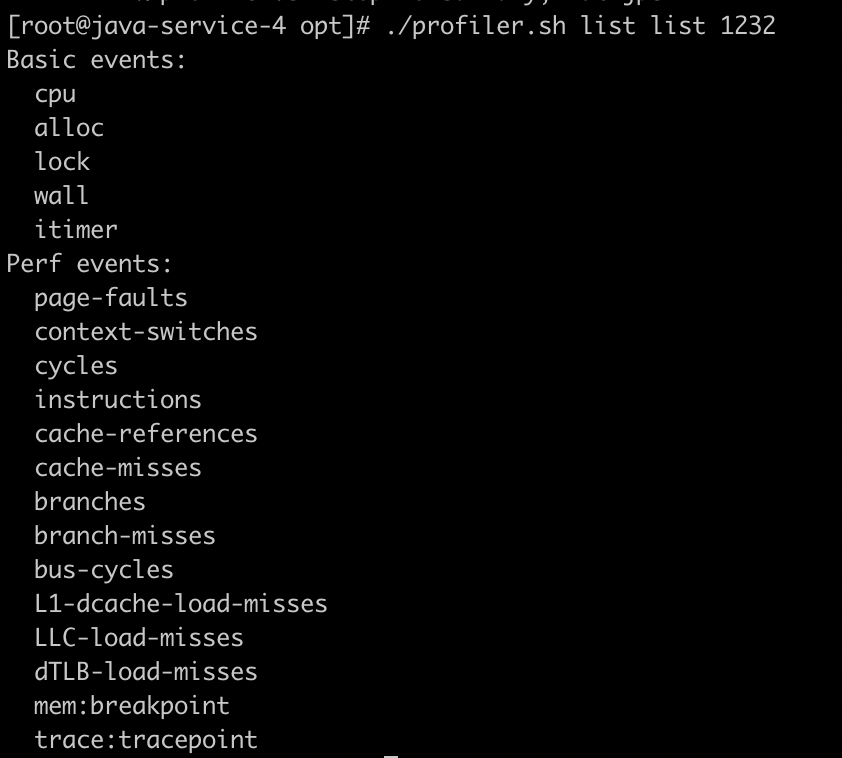
event 可选参数用这个命令来查看

./profiler.sh list list 1232 

输出样例:

img

image

event 默认为cpu,也可以用alloc来查看内存分配

./profiler.sh -e alloc -d 30 -f ./nacos-alloc.svg 1232 

img

image

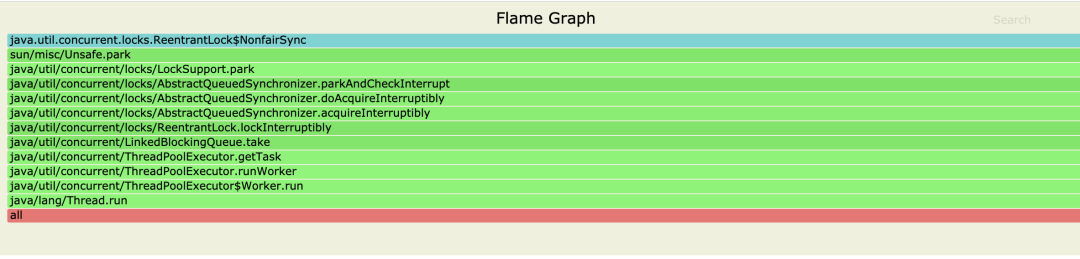
lock查看锁情况:

img

image

其他的模式这里就不一一尝试,用的最多的还是cpu模式。

  • -i N 设置采样频率,默认是10ms,可使用ms,us,s作为单位,无单位默认为纳秒,如
./profiler.sh -i 500us -d 30 
  • -j N 设置栈采样深度
  • -o fmt 设置输出格式:可选的有 summary、traces、flat、jfr、collapsed、svg、tree,最常用的是svg

更多命令可参考async-profiler github主页

一次网关性能压测实例

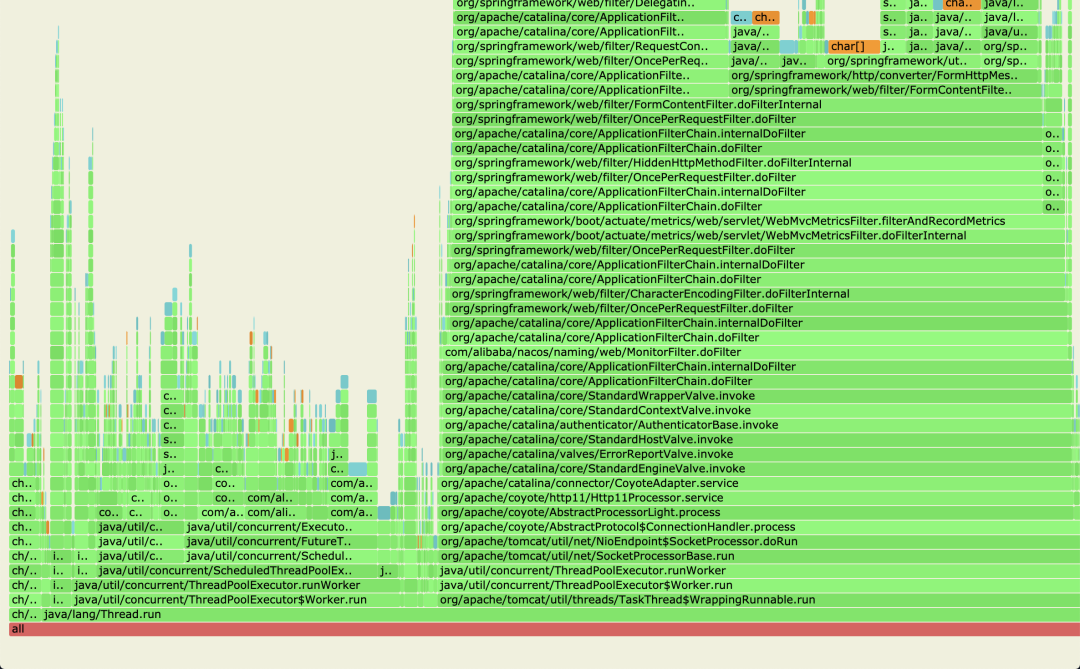
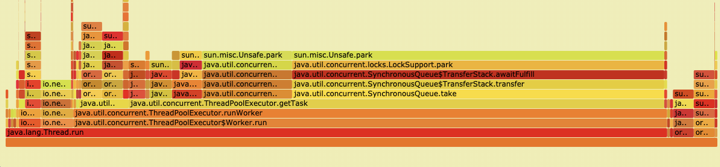
笔者有一次在压测全链路异步网关时,RPS在2000左右,始终上不去,cpu消耗比较高,于是使用async-profiler进行cpu剖析,生成的火焰图如下

img

image

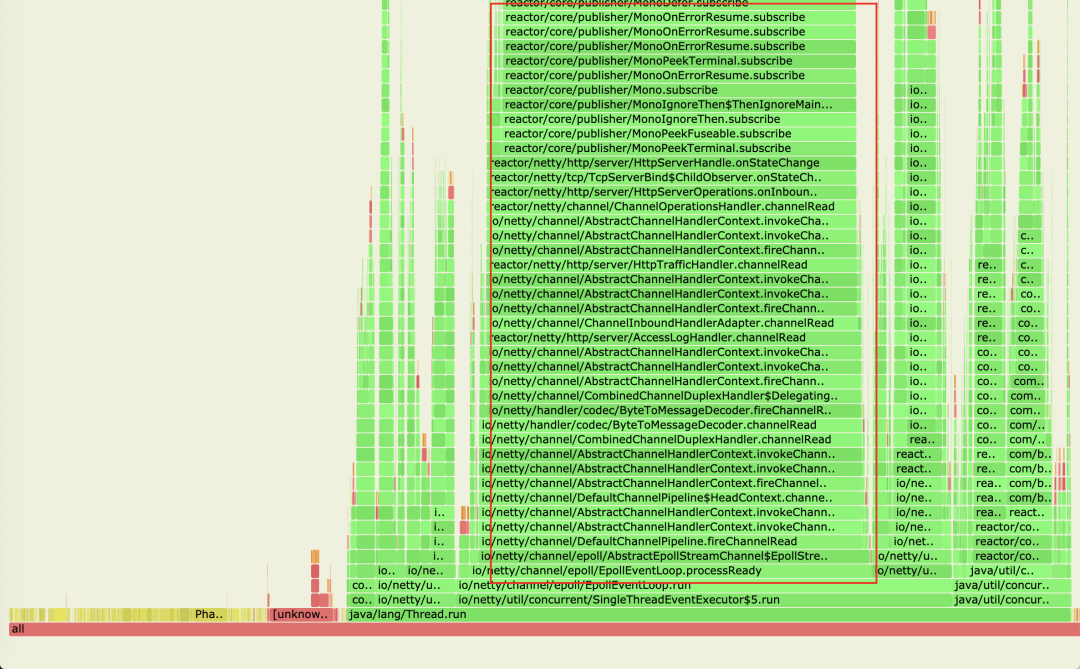
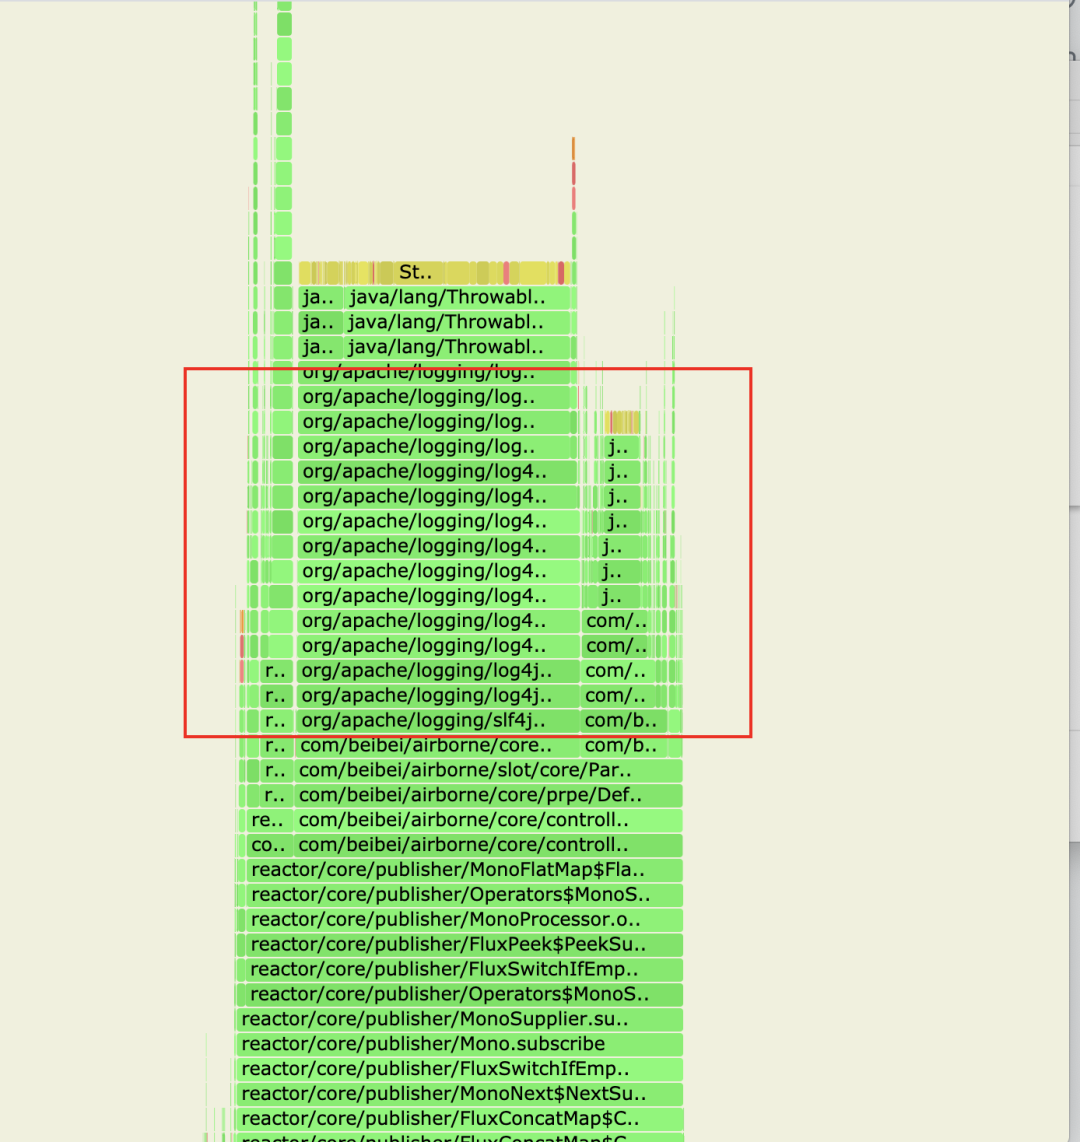
可以看到这里有个宽又深的栈,它消耗了很多cpu,限于图像大小,再往上拉,看下这块到底是什么

img

image

从类名就能看出是log4j,猜测是代码某处打日志过于频繁导致,找到打日志的地方后先去掉日志,压测了一下,果然RPS提升到了5000,一处小小的日志竟有如此大的影响。

原理介绍

看到这里相信你应该会用async-profiler来进行cpu剖析了,如果感兴趣可以了解下async-profiler实现的原理,这块有一篇文章介绍的很详细,可以参考

❝

《JVM CPU Profiler技术原理及源码深度解析》 https://mp.weixin.qq.com/s/RKqmy8dw7B7WtQc6Xy2CLA

❞

简单总结一下:

  • cpu profiler实现一般有两种方案:(1)Sampling,采样(2)Instrumentation,埋点;采样对性能损耗较小但没那么准确,埋点(类似AOP)精准但性能影响大
  • Sampling采样只能在Safe Ponit处采样,会导致统计结果偏差,也就是开头说的Safepoint bias problem,例如某些方法执行时间短,但执行频率高,正真占用了cpu,这部分如果Sampling的采样频率不能足够小,可能就采样不到,但采样频率过高又会影响性能,这就是一般的基于采样的cpu profiler的缺点
  • async-profiler是基于采样实现的,但它又没有Safepoint bias problem,它是通过一种叫做AsyncGetCallTrace的方式来采样,这种采样不需要在安全点处采样,但这个函数不是那么容易就调用到的,需要使用一些技巧(黑科技)的方式来获取

正是第三点原因我才写了这篇文章来推荐这款cpu分析利器,比如我用了一款其他的分析器(uber-common/jvm-profiler)来分析上面网关的cpu,得出了如下的火焰图

img

image

如果是这样,完全没法找到问题。而且阿里开源的Arthas中的cpu分析也是使用的async-profiler。所以你不试试吗?

【Linux】async-profiler async-profiler 本文涉及的图片取自Profiling JVM Applications in Production async-profiler是一个对系统性能影响很少的Java采样分析器,不会存在安全点偏差问题. 它具有特定于HotSpot的API,以收集堆栈跟踪并跟踪内存分配。探查器可与基于HotSpot JVM的OpenJDK,Oracle JDK和其他Java运行时一起使用。... 阅读详情

相关推荐

async-profiler的使用与RocketMQ性能优化案例

async-profiler是一种低开销的Java采样分析器,不会受Safepoint偏差问题的影响。(此处为什么需要大家可以执行去研究一下RocketMQ 5最新的Controller模式也就是A-HA模式,笔者这里就不展开讲了)。从指标中找出项目中可能存在的优化点。通过分析可以知道这个方法在高可用的情况下被调用的频率极高,而使用synchronized关键字在。这里我主要是对两台Broker的机器内存分配情况做了分析生成了火焰图。上图中的那些红色被框出来的地方就是调用了扩容的地方。对应的平台的安装包。

BASK2312的博客 429

async-profiler 使用教程

async-profiler 是一款针对 Java 应用的低开销性能分析工具,它能够采集 CPU 和堆内存的使用情况,并且生成火焰图(Flame Graphs)来帮助开发者直观地分析性能瓶颈。该工具利用了 HotSpot 虚拟机的特定 API 和 Linux 的 perf_events 机制,能够在不引入安全点偏差(Safepoint bias problem)的情况下进行性能分析。 ## 项目

gitblog_00720的博客 1254

cpu分析利器 — async-profiler

本文已收录 https://github.com/lkxiaolou/lkxiaolou 欢迎star。 简介 async-profiler是一款采集分析java性能的工具,翻译一下github上的项目介绍: async-profiler是一款没有Safepoint bias problem的低开销java采集分析器,它利用HotSpot特殊的api来收集栈信息以及内存分配信息,可以在OpenJDK,Oracle JDK以及一些其他的基于HotSpot的java虚拟机。async-profiler可以.

捉虫大师 1200

async-profiler--基础--02--命令说明

此时,可以使用-b N来增加buffer的容量。指定采样的间隔,以纳秒为单位。例如,-i 1000000 表示每1,000,000纳秒(即1毫秒)进行一次采样。用于指定要包含在或排除在采样之外的方法或类。这对于过滤掉不感兴趣的部分或专注于特定部分很有用。在生成的火焰图中折叠或隐藏某些函数。你可以通过指定线程ID或线程名称来实现这一点。可以选择其他类型的事件,如内存分配(-e alloc)。为生成的火焰图或结果文件设置标题。指定采样的持续时间,以秒为单位。该参数将结果写入指定的文件中。指定输出文件的名称。

zhou920786312的博客 1720

async-profiler 之 一二三

https://blog.csdn.net/InstrIsle/article/details/155192811 https://docs.guance.com/best-practices/monitoring/async-profiler/

zhixingheyi_tian的博客 79

告别视频广告:OpenWrt下luci-app-adbyby plus/lite的完整配置与避坑手册

本文详细介绍了在OpenWrt路由器上配置Adbyby Plus/Lite广告屏蔽工具的完整流程与优化方案。从环境准备、规则文件手动配置到高级性能调优,帮助用户有效拦截视频前贴片广告和弹窗广告,提升家庭网络浏览体验。特别针对官方源停止维护的问题,提供了实用的规则更新解决方案。

weixin_29306011的博客 738

Async-profiler介绍

1、介绍 Async-profiler是一个对系统性能影响很少的Java采样分析器,它的实现是基于HotSpot特有的API,通过这些特有的API收集堆栈跟踪和跟踪内存分配,因而其可以和OpenJDK、Oracle JDK和其他基于HotSpot JVM的Java应用在运行时协同工作。 Github项目链接地址:https://github.com/jvm-profiling-tools/as...

冯立彬的博客 1万+

Android音频学习(一)——音频基础

在系统的学习Android音频之前,先了解音频的基础知识。

miemie2014的博客 1484

【亲测免费】 async-profiler 使用教程

async-profiler 使用教程 【免费下载链接】async-profiler Sampling CPU and HEAP profiler for Java featuring AsyncGetCallTrace + perf_events ...

gitblog_00317的博客 861

windsurf中出现无法Connecting to server的解决方案

本文主要介绍了windsurf中出现无法Connecting to server的解决方案,希望能对使用windsurf的同学们有所帮助。 文章目录 1. 问题描述 2. 解决方案

weixin_43178406的博客 6万+

Python基础语法与最佳实践【python基础篇】

本文全面介绍了Python基础语法与最佳实践,涵盖变量与数据类型、控制流、函数、模块与包等核心概念。通过实际代码示例展示了条件语句、循环结构、函数定义及模块导入的基本用法。在最佳实践部分,重点讲解了PEP 8代码风格规范、异常处理技巧、列表推导式、上下文管理器、文档字符串编写以及enumerate和zip的高效使用。这些内容既适合Python初学者掌握基础语法,也能帮助有经验的开发者编写更规范、高效、可维护的代码。文章强调遵循Python官方推荐实践,通过合理运用语言特性提升代码质量。

博客 1975

Async Profiler:最精准的火焰图工具

Async Profiler是一款革命性的性能分析工具,通过异步采样架构实现高性能低开销的分析。其核心架构包含采样引擎层、事件处理层、数据聚合层和输出渲染层,支持CPU、内存分配和锁等多种分析模式。工具采用Perf事件采样和JVMTI回调机制,能够精准捕获调用栈信息并生成火焰图。在生产环境中,Async Profiler通过配置不同的采样间隔和栈深度,可针对CPU、内存分配等不同场景进行优化分析,帮助开发者快速定位性能瓶颈。其独特优势在于极低的开销(通常<2%)和线程态采样能力,为Java应用性能优化

qq_43414012的博客 998

海波龙(Hyperion,现属 Oracle)合并报表以 HFM(Hyperion Financial Management)为核心系统,方法论核心是以控制为基础确定合并范围,通过维度建模统一数据口径

摘要:海波龙合并报表系统(HFM)采用"规则驱动、维度建模"的方法论,通过四个核心环节实现自动化合并:确定合并范围、数据标准化、自动抵销调整及报表生成。系统支持多会计准则,以控制为基础划分合并方法(完全合并/权益法/成本法),通过维度建模统一数据口径,自动处理内部交易抵销、外币折算等复杂操作。业务操作流程涵盖数据采集、转换、抵销调整到报表生成全过程,关键控制点包括内部交易匹配、股权变动处理等。最终输出合规合并报表及完整审计线索,满足监管与管理需求。(150字)

金牌架构师 1304

终极指南:async-profiler的OpenTelemetry集成方案

在分布式系统监控领域,OpenTelemetry(简称OTel)已成为事实上的标准,而async-profiler作为Java性能分析的利器,其新增的OTLP(OpenTelemetry Protocol)协议支持,为构建全链路可观测性提供了关键能力。本文将从实际应用痛点出发,系统讲解如何通过async-profiler实现Java应用性能数据的OTLP标准化输出,帮助开发者快速接入现代可观测性平...

gitblog_00388的博客 735

C#与天文观测:Celestia模拟星空的奇幻之旅

Celestia就像一艘穿梭在星海中的小飞船,带领我们遨游宇宙。C#则是这艘飞船的智能导航系统,用代码指挥它飞向任何我们向往的星球或星系。首先,下载并安装Celestia,熟悉其基本操作和功能。创建一个星空目标列表,包括不同的恒星、行星和星系。// 示例:定义观察目标列表new SpaceObject("太阳"),new SpaceObject("月球"),new SpaceObject("火星")

java专栏 1456

ConvNeXt 系列改进:引入大核注意力(LKA)替换 7×7 深度卷积,涨点 2.1%

LSKA替换7×7深度卷积,在ImageNet分类任务上实现2.1%的显著提升,参数量仅增加1M。LSKA的四层1D分解将计算复杂度从O(k²)降至O(k),21×21大核的计算量仅相当于原版7×7的1.7倍,实现了感受野与计算成本的完美平衡。部署友好度极高:LSKA模块在TensorRT FP16量化后延迟仅1.2ms,精度损失<0.1%,远优于Transformer类模型。下游任务全面领先。

ZXSXJ的博客 699

java性能分析async-profiler

项目地址。

阿呆的专栏 968

【嘉立创EDA】PCB金属包边设计快捷方法

本文使用嘉立创EDA,描述如何在PCB设计时,快速增加边框包边设计,特别是金属包边(伪)——这里标记(伪)是因为该这里的包边特指不含边缘壁。请参考本文时特别注意!本文将此过程记录,以供有需要的读者参考。

l64481000的博客 1737

【亲测免费】 JVM剖析利器:Async Profiler

在Java世界中,性能优化是一项关键任务,而有效的剖析工具则是我们的得力助手。就是这样一款强大的开源JVM剖析工具,它能够帮助我们深入理解应用程序的运行状况,提升性能并定位潜在问题。 ## 项目简介 Async Profiler是由Eugene Khmelevsky创建的一个轻量级、异步的JVM剖析器。它的设计目标是提供一种既简单又高效的性能分析方式,无需复杂的配置,即可进行CPU、内存分配、...

gitblog_00023的博客 850

迈瑞BS系列全自动生化分析仪LIS协议接口手册(内含HL7和ASTM)

迈瑞BS系列全自动生化分析仪LIS协议接口手册,内含HL7和ASTM)

廖雪峰Python教程[完整版]

廖雪峰的python教程整理的,已经排好版了,而且还是完整的,适合小白

arthas火焰图(async-profiler)在云交易中的运用

本文首在通过一款线上监控诊断产品,阿里巴巴的arthas(阿尔萨斯)内部集成的火焰图工具async-profler结合自身系统应用中的使用,方便我们能够快速定位线上问题。

京东零售技术的博客 1400

android 蓝牙通讯demo

android 下蓝牙通讯demo,实现了发现蓝牙,使能蓝牙,通过蓝牙发送消息。

async-profiler 堆栈追踪模式深度解析

async-profiler 堆栈追踪模式深度解析 【免费下载链接】async-profiler Sampling CPU and HEAP profiler for Java featuring AsyncGetCallTrace + perf_events ...

gitblog_01086的博客 453

深度学习工具包 DeepLearningToolbox

深度学习工具包Deprecation notice.-----This toolbox is outdated and no longer maintained.There are much better tools available for deep learning than this toolbox, e.g. [Theano](http://deeplearning.net/software/theano/), [torch](http://torch.ch/) or [tensorflow](http://www.tensorflow.org/)I would suggest you use one of the tools mentioned above rather than use this toolbox.Best, Rasmus.DeepLearnToolbox================A Matlab toolbox for Deep Learning.Deep Learning is a new subfield of machine learning that focuses on learning deep hierarchical models of data.It is inspired by the human brain's apparent deep (layered, hierarchical) architecture.A good overview of the theory of Deep Learning theory is[Learning Deep Architectures for AI](http://www.iro.umontreal.ca/~bengioy/papers/ftml_book.pdf)For a more informal introduction, see the following videos by Geoffrey Hinton and Andrew Ng.* [The Next Generation of Neural Networks](http://www.youtube.com/watch?v=AyzOUbkUf3M) (Hinton, 2007)* [Recent Developments in Deep Learning](http://www.youtube.com/watch?v=VdIURAu1-aU) (Hinton, 2010)* [Unsupervised Feature Learning and Deep Learning](http://www.youtube.com/watch?v=ZmNOAtZIgIk) (Ng, 2011)If you use this toolbox in your research please cite [Prediction as a candidate for learning deep hierarchical models of data](http://www2.imm.dtu.dk/pubdb/views/publication_details.php?id=6284)```@MASTERSTHESIS\{IMM2012-06284, author = "R. B. Palm", title = "Prediction as a candidate for learning deep hierarchical models of data", year = "2012",}```Contact: rasmusbergpalm at gmail dot comDirectories included in the toolbox-----------------------------------`NN/` - A library for Feedforward Backpropagation Neural Networks`CNN/` - A library for Convolutional Neural Networks`DBN/` - A library for Deep Belief Networks`SAE/` - A library for Stacked Auto-Encoders`CAE/` - A library for Convolutional Auto-Encoders`util/` - Utility functions used by the libraries`data/` - Data used by the examples`tests/` - unit tests to verify toolbox is workingFor references on each library check REFS.mdSetup-----1. Download.2. addpath(genpath('DeepLearnToolbox'));Example: Deep Belief Network---------------------```matlabfunction test_example_DBNload mnist_uint8;train_x = double(train_x) / 255;test_x = double(test_x) / 255;train_y = double(train_y);test_y = double(test_y);%% ex1 train a 100 hidden unit RBM and visualize its weightsrand('state',0)dbn.sizes = [100];opts.numepochs = 1;opts.batchsize = 100;opts.momentum = 0;opts.alpha = 1;dbn = dbnsetup(dbn, train_x, opts);dbn = dbntrain(dbn, train_x, opts);figure; visualize(dbn.rbm{1}.W'); % Visualize the RBM weights%% ex2 train a 100-100 hidden unit DBN and use its weights to initialize a NNrand('state',0)%train dbndbn.sizes = [100 100];opts.numepochs = 1;opts.batchsize = 100;opts.momentum = 0;opts.alpha = 1;dbn = dbnsetup(dbn, train_x, opts);dbn = dbntrain(dbn, train_x, opts);%unfold dbn to nnnn = dbnunfoldtonn(dbn, 10);nn.activation_function = 'sigm';%train nnopts.numepochs = 1;opts.batchsize = 100;nn = nntrain(nn, train_x, train_y, opts);[er, bad] = nntest(nn, test_x, test_y);assert(er < 0.10, 'Too big error');```Example: Stacked Auto-Encoders---------------------```matlabfunction test_example_SAEload mnist_uint8;train_x = double(train_x)/255;test_x = double(test_x)/255;train_y = double(train_y);test_y = double(test_y);%% ex1 train a 100 hidden unit SDAE and use it to initialize a FFNN% Setup and train a stacked denoising autoencoder (SDAE)rand('state',0)sae = saesetup([784 100]);sae.ae{1}.activation_function = 'sigm';sae.ae{1}.learningRate = 1;sae.ae{1}.inputZeroMaskedFraction = 0.5;opts.numepochs = 1;opts.batchsize = 100;sae = saetrain(sae, train_x, opts);visualize(sae.ae{1}.W{1}(:,2:end)')% Use the SDAE to initialize a FFNNnn = nnsetup([784 100 10]);nn.activation_function = 'sigm';nn.learningRate = 1;nn.W{1} = sae.ae{1}.W{1};% Train the FFNNopts.numepochs = 1;opts.batchsize = 100;nn = nntrain(nn, train_x, train_y, opts);[er, bad] = nntest(nn, test_x, test_y);assert(er < 0.16, 'Too big error');```Example: Convolutional Neural Nets---------------------```matlabfunction test_example_CNNload mnist_uint8;train_x = double(reshape(train_x',28,28,60000))/255;test_x = double(reshape(test_x',28,28,10000))/255;train_y = double(train_y');test_y = double(test_y');%% ex1 Train a 6c-2s-12c-2s Convolutional neural network %will run 1 epoch in about 200 second and get around 11% error. %With 100 epochs you'll get around 1.2% errorrand('state',0)cnn.layers = { struct('type', 'i') %input layer struct('type', 'c', 'outputmaps', 6, 'kernelsize', 5) %convolution layer struct('type', 's', 'scale', 2) %sub sampling layer struct('type', 'c', 'outputmaps', 12, 'kernelsize', 5) %convolution layer struct('type', 's', 'scale', 2) %subsampling layer};cnn = cnnsetup(cnn, train_x, train_y);opts.alpha = 1;opts.batchsize = 50;opts.numepochs = 1;cnn = cnntrain(cnn, train_x, train_y, opts);[er, bad] = cnntest(cnn, test_x, test_y);%plot mean squared errorfigure; plot(cnn.rL);assert(er<0.12, 'Too big error');```Example: Neural Networks---------------------```matlabfunction test_example_NNload mnist_uint8;train_x = double(train_x) / 255;test_x = double(test_x) / 255;train_y = double(train_y);test_y = double(test_y);% normalize[train_x, mu, sigma] = zscore(train_x);test_x = normalize(test_x, mu, sigma);%% ex1 vanilla neural netrand('state',0)nn = nnsetup([784 100 10]);opts.numepochs = 1; % Number of full sweeps through dataopts.batchsize = 100; % Take a mean gradient step over this many samples[nn, L] = nntrain(nn, train_x, train_y, opts);[er, bad] = nntest(nn, test_x, test_y);assert(er < 0.08, 'Too big error');%% ex2 neural net with L2 weight decayrand('state',0)nn = nnsetup([784 100 10]);nn.weightPenaltyL2 = 1e-4; % L2 weight decayopts.numepochs = 1; % Number of full sweeps through dataopts.batchsize = 100; % Take a mean gradient step over this many samplesnn = nntrain(nn, train_x, train_y, opts);[er, bad] = nntest(nn, test_x, test_y);assert(er < 0.1, 'Too big error');%% ex3 neural net with dropoutrand('state',0)nn = nnsetup([784 100 10]);nn.dropoutFraction = 0.5; % Dropout fraction opts.numepochs = 1; % Number of full sweeps through dataopts.batchsize = 100; % Take a mean gradient step over this many samplesnn = nntrain(nn, train_x, train_y, opts);[er, bad] = nntest(nn, test_x, test_y);assert(er < 0.1, 'Too big error');%% ex4 neural net with sigmoid activation functionrand('state',0)nn = nnsetup([784 100 10]);nn.activation_function = 'sigm'; % Sigmoid activation functionnn.learningRate = 1; % Sigm require a lower learning rateopts.numepochs = 1; % Number of full sweeps through dataopts.batchsize = 100; % Take a mean gradient step over this many samplesnn = nntrain(nn, train_x, train_y, opts);[er, bad] = nntest(nn, test_x, test_y);assert(er < 0.1, 'Too big error');%% ex5 plotting functionalityrand('state',0)nn = nnsetup([784 20 10]);opts.numepochs = 5; % Number of full sweeps through datann.output = 'softmax'; % use softmax outputopts.batchsize = 1000; % Take a mean gradient step over this many samplesopts.plot = 1; % enable plottingnn = nntrain(nn, train_x, train_y, opts);[er, bad] = nntest(nn, test_x, test_y);assert(er < 0.1, 'Too big error');%% ex6 neural net with sigmoid activation and plotting of validation and training error% split training data into training and validation datavx = train_x(1:10000,:);tx = train_x(10001:end,:);vy = train_y(1:10000,:);ty = train_y(10001:end,:);rand('state',0)nn = nnsetup([784 20 10]); nn.output = 'softmax'; % use softmax outputopts.numepochs = 5; % Number of full sweeps through dataopts.batchsize = 1000; % Take a mean gradient step over this many samplesopts.plot = 1; % enable plottingnn = nntrain(nn, tx, ty, opts, vx, vy); % nntrain takes validation set as last two arguments (optionally)[er, bad] = nntest(nn, test_x, test_y);assert(er < 0.1, 'Too big error');```[![Bitdeli Badge](https://d2weczhvl823v0.cloudfront.net/rasmusbergpalm/deeplearntoolbox/trend.png)](https://bitdeli.com/free "Bitdeli Badge")

Mac电脑使用火焰图async-profiler

前言:火焰图是一个非常好用的工具,他能直观的帮助我们去分析程序中方法的调用,你可以将它看作是一个栈。当我们需要对项目进行调优时候,就可以利用火焰图来分析项目中cpu的一个占用情况。下面来简单介绍一下这个工具怎么使用 进入网站https://github.com/jvm-profiling-tools/async-profiler 下载火焰图工具,这个工具貌似只能使用在mac系统和Linux系统上,window系统目前好像还不支持 下载后解压,mac系统自动解压 编写一个测试类,实际应用中这里运行的就是

稚彦的博客 2560

Java NMT与async-profiler结合:全面掌握JVM内存使用情况

你是否还在为JVM内存泄漏问题头疼?是否尝试过多种工具却依然无法定位内存瓶颈?本文将展示如何通过Java NMT(Native Memory Tracking,原生内存追踪)与async-profiler的组合,构建完整的JVM内存监控体系。读完本文你将掌握:NMT基础配置与数据解读、async-profiler内存采样技巧、两者数据关联分析方法,以及实战案例中的内存问题定位流程。 ## 内存问...

gitblog_00500的博客 973

async-profiler分配采样:内存分配热点分析

在Java应用性能优化中,内存分配往往是最大的性能瓶颈之一。你是否遇到过这样的场景: - 应用在高负载下频繁GC,响应时间急剧上升 - 堆内存使用率居高不下,但无法确定具体是哪些代码导致的 - 尝试优化代码后,内存使用情况改善不明显 传统的Java内存分析工具要么侵入性强、性能开销大,要么无法提供准确的分配热点信息。async-profiler的分配采样功能正是为了解决这些问题而生,它能够以极...

gitblog_00437的博客 995

async-profiler架构深度剖析:核心组件与模块设计

async-profiler架构深度剖析:核心组件与模块设计 【免费下载链接】async-profiler Sampling CPU and HEAP profiler for Java featuring AsyncGetCallTrace + perf_events ...

gitblog_01124的博客 1034
上一篇: 殷浩详解DDD:如何避免写流水账代码?
下一篇: 由 RedisTemplate 事务 enableTransactionSupport 引发的血案
zero__007
博客等级 码龄12年 326粉丝 247原创
评论
成就一亿技术人!
拼手气红包6.0元
还能输入1000个字符
 
 条评论被折叠 查看
添加红包

请填写红包祝福语或标题

个

红包个数最小为10个

元

红包金额最低5元

当前余额3.43元 前往充值 >
需支付:10.00元
成就一亿技术人!
领取后你会自动成为博主和红包主的粉丝 规则
hope_wisdom
发出的红包
实付元
使用余额支付
点击重新获取
扫码支付
钱包余额 0

抵扣说明:

1.余额是钱包充值的虚拟货币,按照1:1的比例进行支付金额的抵扣。
2.余额无法直接购买下载,可以购买VIP、付费专栏及课程。

余额充值