


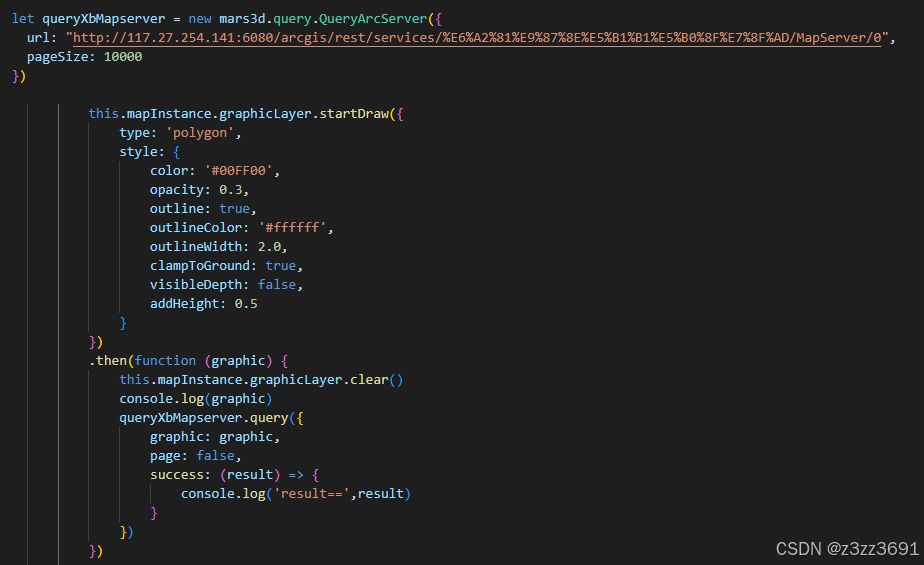
QueryArcServer使用:通过动态画个拆线区域,查出这个区域的图层属性
动态画点线面
/**
 * 地图画点
 */
export function drawPoint(o?: { style?: any; callback?: Fn }) {
  graphicLayer
    .startDraw({
      type: 'point',
      style: o ? (o.style ? o.style : drawPointStyle) : drawPointStyle
    })
    .then(function (graphic) {
      if (o && o.callback) {
        o.callback(graphic)
      }
    })
}

/**
 * 地图画线
 */
export function drawPolyline(o?: { style?: any; callback?: Fn }) {
  graphicLayer
    .startDraw({
      type: 'polyline',
      style: o ? (o.style ? o.style : drawPolylineStyle) : drawPolylineStyle
    })
    .then(function (graphic) {
      if (o && o.callback) {
        o.callback(graphic)
      }
    })
}

/**
 * 地图画面
 */
export function drawPolygon(o?: { style?: any; callback?: Fn }) {
  graphicLayer
    .startDraw({
      type: 'polygon',
      style: o ? (o.style ? o.style : drawPolygonStyle) : drawPolygonStyle
    })
    .then(function (graphic) {
      if (o && o.callback) {
        o.callback(graphic)
      }
    })
}
/**
 * 地图画面
 */
 export function drawByType(o?: { type?: any;style?: any; callback?: Fn }) {
  graphicLayer
    .startDraw({
      type: o.type,
      style: o ? (o.style ? o.style : drawPolygonStyle) : drawPolygonStyle
    })
    .then(function (graphic) {
      if (o && o.callback) {
        o.callback(graphic)
      }
    })
}
/**
 * 地图上标注
 * @param o
 */
export function labelEntity(o: {
  position: any
  style: any
  attr?: any
  flyTo?: boolean
  callback?: Fn
  layerType?: any
}) {
  const graphic = new mars3d.graphic.LabelEntity({
    position: o.position,
    style: o.style,
    attr: o.attr || null,
    flyTo: o.flyTo || true
  })
  if (o.layerType == 2) {
    tempGraphicLayer.addGraphic(graphic)
  } else {
    graphicLayer.addGraphic(graphic)
  }
  if (o.callback) {
    o.callback(graphic)
  }
}

export function addFeature(arr, callbackFn) {
  if (graphicLayer) {
    graphicLayer.clear()
  }
  // 创建矢量数据图层
  graphicLayer = new mars3d.layer.GraphicLayer({
    // 点的聚合配置
    clustering: {
      enabled: true,
      pixelRange: 20
      // opacity: 1,
      // getImage: function (count) {   //getImage是完全自定义方式
      //   let colorIn
      //   if (count < 10) {
      //     colorIn = 'rgba(110, 204, 57, 0.6)'
      //   } else if (count < 100) {
      //     colorIn = 'rgba(240, 194, 12,  0.6)'
      //   } else {
      //     colorIn = 'rgba(241, 128, 23,  0.6)'
      //   }
      //   return mars3d.Util.getCircleImage(count, {
      //     color: colorIn,
      //     radius: 30,
      //   })
      // },
    }
    // tooltip: '{text}',
  })
  map.addLayer(graphicLayer)

  graphicLayer.bindPopup(function (event) {
    const item = event.graphic?.attr
    if (!item) {
      return false
    }
    if (callbackFn) {
      callbackFn(item.id)
    }
    else{
      const inthtml =
        `<table style="width: auto;padding-top:20px;">
                          <tr><td>编号:</td><td>` +
        item.serialNumber +
        `</td></tr>
                                <tr><td>树中文名:</td><td>` +
        item.latitude +
        `</td></tr>
                        </table>`
        return inthtml
    }
  })

  // 单击事件
  graphicLayer.on(mars3d.EventType.click, function (event) {
    if (event.id instanceof Array) {
      console.log('单击了聚合的点', event)
      // // 单击了聚合的点
      // const arrEntity = event.pickedObject.id
      // map.flyTo(arrEntity)
      // const address = event.graphic?.entities[0].properties.address

      if (callbackFn) {
        callbackFn(event.id)
      }
    } else {
      const graphic = event.graphic
      if (graphic) {
        // 单击了具体的点对象
        const position = graphic.positionShow
        // map.flyToPoint(position, {
        //   radius: 5000, // 距离目标点的距离
        //   duration: 4,
        //   complete: function (e) {
        //     // 飞行完成回调方法
        //     // graphic.openPopup();
        //   }
        // })
        map.flyTo(position)
      }
    }
  })

  for (let i = 0, len = arr.length; i < len; i++) {
    const item = arr[i]
    const graphic = new mars3d.graphic.BillboardEntity({
      position: new mars3d.LngLatPoint(item.longitude, item.latitude, 0),
      style: {
        image: '/image/258.png',
        horizontalOrigin: Cesium.HorizontalOrigin.CENTER,
        verticalOrigin: Cesium.VerticalOrigin.BOTTOM,
        scaleByDistance: new Cesium.NearFarScalar(1000, 0.7, 5000000, 0.3)
        // label: {
        //   text: item.treeName,
        //   font_size: 19,
        //   color: Cesium.Color.AZURE,
        //   outline: true,
        //   outlineColor: Cesium.Color.BLACK,
        //   outlineWidth: 2,
        //   horizontalOrigin: Cesium.HorizontalOrigin.LEFT,
        //   verticalOrigin: Cesium.VerticalOrigin.BOTTOM,
        //   pixelOffset: new Cesium.Cartesian2(10, 0), // 偏移量
        //   distanceDisplayCondition: new Cesium.DistanceDisplayCondition(0.0, 80000)
        // }
      },
      attr: item
    })

    graphicLayer.addGraphic(graphic)
  }
}

export function openPopup(position, popupHtml) {
  // 关闭弹窗
  map.closePopup()
  // 传入坐标和内容,可以直接任意弹出
  // const position = [116.328539, 30.978731, 1521]
  map.openPopup(position, popupHtml)
}

/**
 * 地图上画点
 * @param o
 */
export function pointEntity(o: {
  position: any
  style: any
  attr?: any
  model?: any
  hasEdit?: boolean
  flyTo?: boolean
  popup?: { content?: string }
  tooltip?: { content?: string }
  graphicLayer?: any
  callback?: Fn
}) {
  const graphic = new mars3d.graphic.PointEntity({
    position: o.position,
    style: o.style,
    attr: o.attr || null,
    model: o.model || null,
    hasEdit: o.hasEdit || false,
    flyTo: o.flyTo || true
  })
  if (o && o.popup && o.popup.content) {
    graphic.bindPopup(o.popup.content)
  }
  if (o && o.tooltip && o.tooltip.content) {
    graphic.bindTooltip(o.tooltip.content)
  }

  if (o && o.graphicLayer) {
    o.graphicLayer.addGraphic(graphic)
  } else {
    graphicLayer.addGraphic(graphic)
  }

  if (o.callback) {
    o.callback(graphic)
  }
}

/**
 * 地图上画线
 * @param o
 */
export function pathEntity(o: {
  position: any
  style: any
  attr?: any
  model?: any
  label?: any
  flyTo?: boolean
  popup?: { content?: string }
  tooltip?: { content?: string }
  graphicLayer?: any
  callback?: Fn
}) {
  const graphic = new mars3d.graphic.PathEntity({
    position: o.position || null,
    style: o.style,
    attr: o.attr || null,
    model: o.model || null,
    label: o.label || null,
    flyTo: o.flyTo || true
  })
  if (o && o.popup && o.popup.content) {
    graphic.bindPopup(o.popup.content)
  }
  if (o && o.tooltip && o.tooltip.content) {
    graphic.bindTooltip(o.tooltip.content)
  }
  if (o && o.graphicLayer) {
    o.graphicLayer.addGraphic(graphic)
  } else {
    graphicLayer.addGraphic(graphic)
  }
  if (o.callback) {
    o.callback(graphic)
  }
}

/**
 * 地图上画线
 * @param o
 */
export function polylineEntity(o: {
  positions: any
  style: any
  attr?: any
  flyTo?: boolean
  hasEdit?: boolean
  popup?: { content?: string }
  tooltip?: { content?: string }
  graphicLayer?: any
  callback?: Fn
}) {
  const graphic = new mars3d.graphic.PolylineEntity({
    positions: o.positions || [],
    style: o.style,
    attr: o.attr || null,
    hasEdit: o.hasEdit || false,
    flyTo: o.flyTo || true
  })
  if (o && o.popup && o.popup.content) {
    graphic.bindPopup(o.popup.content)
  }
  if (o && o.tooltip && o.tooltip.content) {
    graphic.bindTooltip(o.tooltip.content)
  }
  if (o && o.graphicLayer) {
    o.graphicLayer.addGraphic(graphic)
  } else {
    graphicLayer.addGraphic(graphic)
  }
  if (o.callback) {
    o.callback(graphic)
  }
}

/**
 * 地图上画面
 * @param o
 */
export function polygonEntity(o: {
  positions: any
  style: any
  attr?: any
  flyTo?: boolean
  hasEdit?: boolean
  popup?: { content?: string }
  tooltip?: { content?: string }
  graphicLayer?: any
  callback?: Fn
}) {
  const graphic = new mars3d.graphic.PolygonEntity({
    positions: o.positions,
    style: o.style,
    attr: o.attr || null,
    hasEdit: o.hasEdit || false,
    flyTo: o.flyTo || true
  })
  if (o && o.popup && o.popup.content) {
    graphic.bindPopup(o.popup.content)
  }
  if (o && o.tooltip && o.tooltip.content) {
    graphic.bindTooltip(o.tooltip.content)
  }
  if (o && o.graphicLayer) {
    o.graphicLayer.addGraphic(graphic)
  } else {
    graphicLayer.addGraphic(graphic)
  }
  if (o.callback) {
    o.callback(graphic)
  }
}
/**
* 经纬度定位
* @param o
*/
export function location(o: { lng: number; lat: number; alt?: number; callback?: Fn }) {
map.setCameraView({ lat: o.lat, lng: o.lng, alt: o.alt || 0 })
}
//添加热力图 图层
export function heatLayer(arrPoints){
console.log(arrPoints)
const layerId = "heatLayer"
const existingLayer = map.getLayer(layerId);
if (existingLayer) {
//map.removeLayer(existingLayer);
}
const heatLayer = new mars3d.layer.HeatLayer({
id:layerId,
positions: arrPoints,
max: 2000,
heatStyle: {
radius: 25,
minOpacity: 0.1,
maxOpacity: 0.8,
blur: 0.5,
gradient: {
0: '#808080', 0.4: 'blue', 0.6: 'green',0.8: 'yellow',0.9: 'red'
}
},
// 以下为矩形矢量对象的样式参数
style: {
opacity: 1.0
// ,clampToGround: true
},
center:{
lng:119.558721,
lat:26.558270,
alt:311111
},
allowDrillPick:true,
flyTo: true
})
map.addLayer(heatLayer)
}
//添加热力图 图层
export function heatLayer2(arrPoints, height){
const layerId = "heatLayer"
const existingLayer = map.getLayer(layerId);
if (existingLayer) {
map.removeLayer(existingLayer);
}
// 热力图 图层
const heatLayer = new mars3d.layer.HeatLayer({
id:layerId,
positions: arrPoints,
// rectangle: {
// xmin: 115.784446,
// xmax: 116.504163,
// ymin: 24.635310,
// ymax: 25.578549
// },
heatStyle: {
radius: 60,
blur: 0.95
},
// 以下为矩形矢量对象的样式参数
style: {
height: height
},
flyTo: true
})
map.addLayer(heatLayer)
}
export function createWmsLayer(wmsUrl,layerName, opacity=1) {
  if (!layerName) {
    return null;
  }
  const wmsLayer = new mars3d.layer.WmsLayer({
    id: layerName,
    name: layerName,
    url: wmsUrl,
    layers: layerName,
    crs: 'EPSG:4326',
    parameters: {
      transparent: true,
      format: 'image/png'
    },
    opacity: opacity, // 设置透明度,
    // show: false,
    flyTo: true
  });

  wmsLayer.bindPopup(function (event) {
    const item = event.attr
    let inthtml = `<table style="width: auto;padding-top:20px;">`
    Object.keys(item).forEach(key => {
      inthtml += `<tr><td>`+ key +`:</td><td>` + item[key] + `</td></tr>`
    });
    inthtml += `</table>`
    return inthtml
  })

  const queryLayer = new mars3d.query.QueryGeoServer({
    url: wmsUrl,
    layer: layerName
  })
  const cql_filter = 'where 1=1'
  queryLayer.queryBySql({
    cql_filter: cql_filter,
    success: function(result){
      console.log(result)
      if(result.geojson && result.geojson.features){
      }
    }
  })

  map.addLayer(wmsLayer)
}

export function loadPointGraphic(list: any, callbackFn, layerIndex){
  let glayer = tempGraphicLayer
  let totalLongitude = 0;
  let totalLatitude = 0;
  // const points = [] as any[]// [[117.271662, 31.870639, 21.49]]
  list.forEach((item) => {
    totalLongitude += parseFloat(item.longitude); // 累加经度
    totalLatitude += parseFloat(item.latitude);  // 累加纬度
    const pointColor = "#ff0000"
    const graphic = new mars3d.graphic.PointEntity({
      position: new mars3d.LngLatPoint(item.longitude, item.latitude),
      style: {
        color: pointColor,
        pixelSize: 15,
        opacity: 1,
        outlineColor: "#ffffff",
        outlineWidth: 2,
        highlight: {
          opacity: 0.85
        }
      },
      attr: {
        ...item
      }
    })
    glayer.addGraphic(graphic)
  })

  glayer.bindPopup(function (event) {
    const item = event.graphic?.attr
    if (callbackFn) {
      callbackFn(item.id)
    }
  })

  const centerLongitude = totalLongitude / list.length; // 计算平均经度
  const centerLatitude = totalLatitude / list.length;   // 计算平均纬度
  location({lng:centerLongitude, lat:centerLatitude, alt:140000})

}


 542
542

 被折叠的 条评论
为什么被折叠?
被折叠的 条评论
为什么被折叠?
 到【灌水乐园】发言


