


import matplotlib.pyplot as plt
import numpy as np
from sklearn.cluster import KMeans
from sklearn.datasets import load_iris
# 设置 matplotlib 支持中文显示
plt.rcParams['font.sans-serif'] = ['SimHei']
plt.rcParams['axes.unicode_minus'] = False
# 加载鸢尾花数据集
iris = load_iris()
X = iris.data[:]
# 打印数据集特征和形状
print(X)
print(X.shape)
# 绘制原始数据散点图
plt.scatter(X[:, 0], X[:, 1], c="red", marker='o')
plt.xlabel('petal length')
plt.ylabel('petal width')
plt.legend(loc=2)
plt.show()
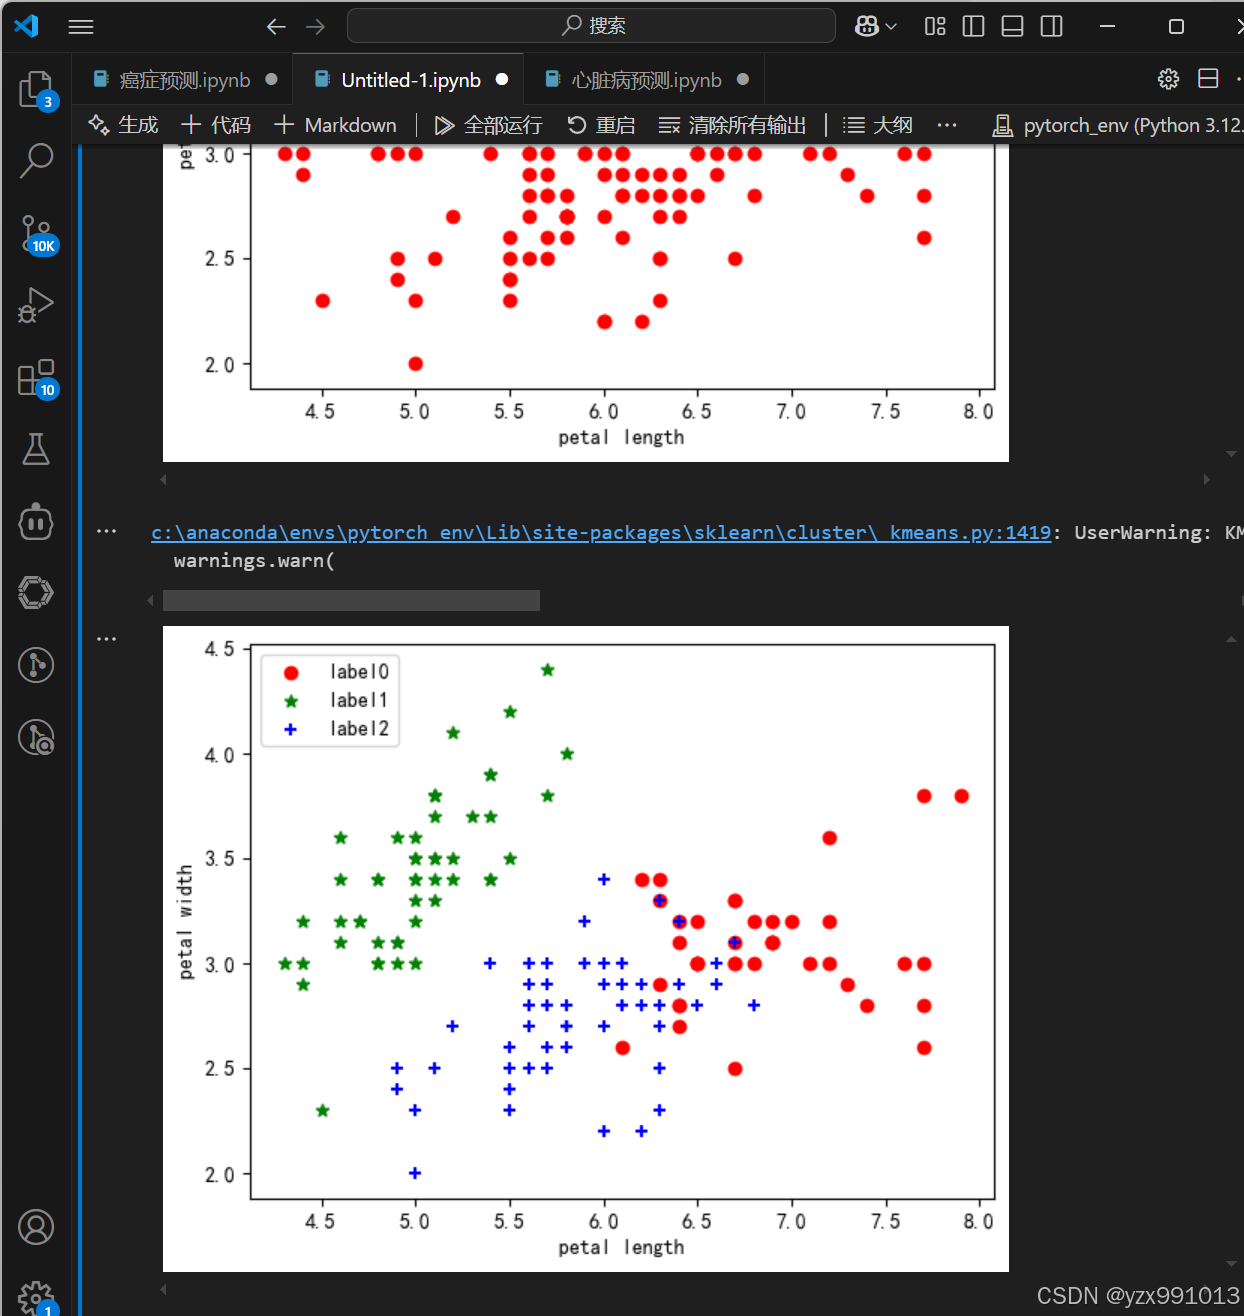
# 构建 K-Means 聚类器并进行聚类
estimator = KMeans(n_clusters=3)
estimator.fit(X)
label_pred = estimator.labels_
# 按聚类标签分组绘制散点图
x0 = X[label_pred == 0]
x1 = X[label_pred == 1]
x2 = X[label_pred == 2]
plt.scatter(x0[:, 0], x0[:, 1], c="red", marker='o', label='label0')
plt.scatter(x1[:, 0], x1[:, 1], c="green", marker='*', label='label1')
plt.scatter(x2[:, 0], x2[:, 1], c="blue", marker='+', label='label2')
plt.xlabel('petal length')
plt.ylabel('petal width')
plt.legend(loc=2)
plt.show()
# 选取部分特征
X = iris.data[:, 2:]
print(X)
print(X.shape)
# 使用肘方法确定最佳聚类数
d = []
for i in range(1, 11):
km = KMeans(n_clusters=i, init='k-means++', n_init=10, max_iter=300, random_state=0)
km.fit(X)
d.append(km.inertia_)
plt.plot(range(1, 11), d, marker='o')
plt.xlabel('number of clusters')
plt.ylabel('distortions')
plt.show()


 880
880

 被折叠的 条评论
为什么被折叠?
被折叠的 条评论
为什么被折叠?
 到【灌水乐园】发言


