


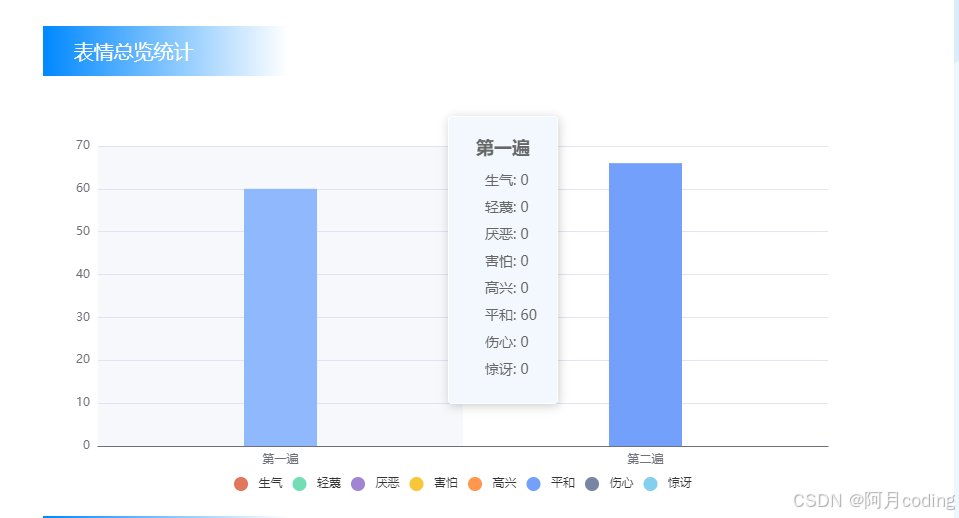
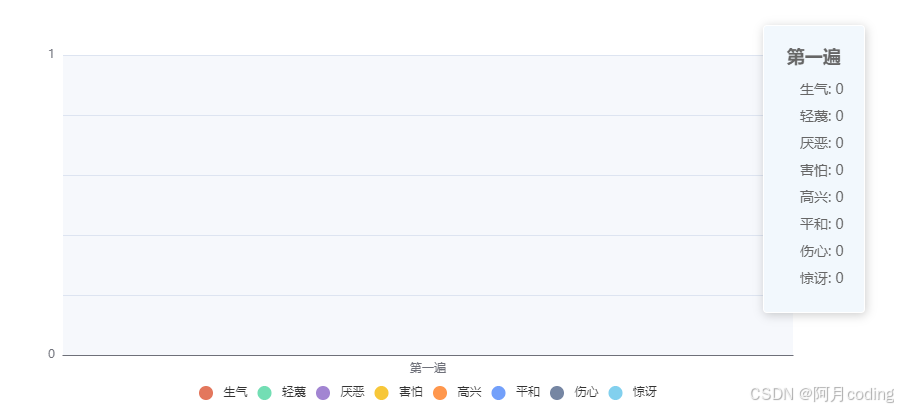
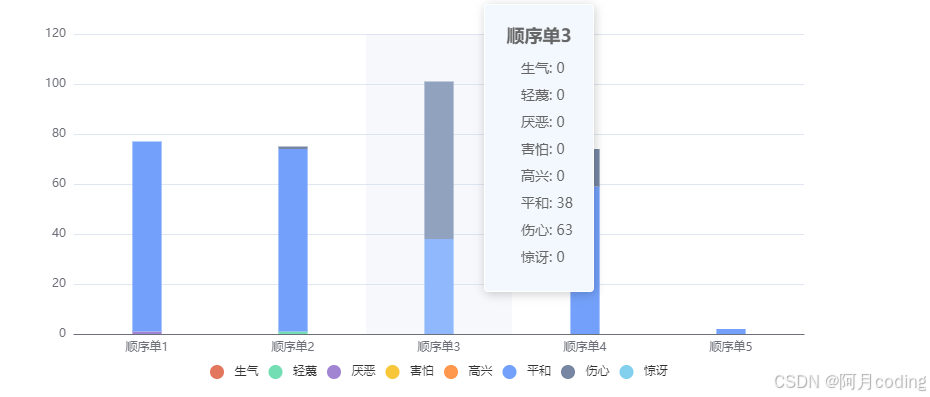
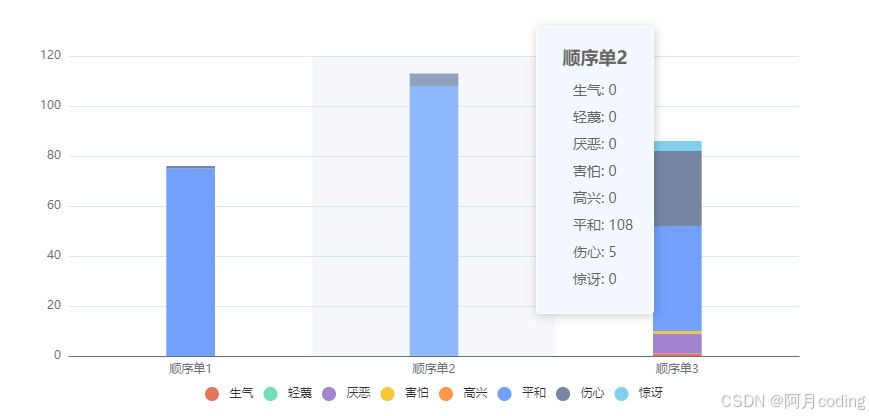
效果图:
实现代码
tooltip: {
      trigger: 'axis',
      backgroundColor: '#f2f8fd', // 设置背景色
      padding: [10, 20], // 设置内边距(可选)
      textStyle: {
        align: 'center' // 设置文本居中
      },
      axisPointer: {
        type: 'shadow' // 使 tooltip 跟随柱子的阴影
      },
      position: function (point, params, dom, rect, size) {
        const average = 800 / totalData.length
        let x = 0
        for (let i = 0; i < totalData.length; i++) {
          if (totalData.length === 1) {//防止数量为1的时候不要偏移出去太多
            x = average * (params[i].dataIndex + 1)
          } else {
            x =
              average * (params[i].dataIndex + 1) +
              50 * (1 - params[i].dataIndex / totalData.length)
          }
        }
        return [x, 20]
      },
      formatter: function (params) {
        // params 是一个数组,遍历每个对象
        let result = ''

        result += `<div style="font-size:18px;font-weight:700;line-height:20px;margin-bottom:20px;margin-top:10px">${params[0].name}</div>`

        params.forEach(function (item) {
          // 拼接每个系列的数据
          result += `<div style="text-align:left;margin-left:16px;line-height:6px;">${item.seriesName}: ${item.value}</div><br>`
        })

        return result
      }
    },


 686
686

 被折叠的 条评论
为什么被折叠?
被折叠的 条评论
为什么被折叠?
 到【灌水乐园】发言


