


 超级会员免费看
 本文介绍了如何在Zabbix中进行自定义监控,包括监控Nginx网站和数据库重要指标。通过设置键值、触发器函数,结合命令或脚本,实现对Nginx状态和数据库性能的实时监控,并在Web页面上展示监控结果和图形。
目录
只要是能用命令、脚本取出来的内容就都可以自定义监控。
常用键值与触发器函数
1.键值
| 常用键值 | 解释说明 |
|---|---|
| agent.hostname | 主机名 |
| system.hostname | 主机名 |
| agent.ping | 客户端可达性检查。返回 nothing - 不可 达;1 - 可达 |
| net.if.in[if,] | 网络接口上传(进入)流量统计。返回 整数 if表示网卡名字 可以忽略 |
| net.if.out[if,] | 流出流量统计。返回整数 |
| proc.num[,,,,] | 进程数。返回整数 |
| net.tcp.port[,port] | 检查是否能建立 TCP 连接到指定端口。 返回 0 - 不能连接;1 - 可以连接 |
| agent.hostmetadata | Agent host metadata. Returns string |
| agent.variant | Agent variant check. Returns 1 - for Zabbix agent; 2 - for Zabbix agent 2 |
| agent.version | zabbix客户端(agent)的版本。返回字符串 |
| kernel.maxfiles | 操作系统最大的文件打开数量。返回整数 |
| kernel.maxproc | 操作系统最大的进程数。返回整数 |
| kernel.openfiles | Number of currently open file descriptors. Returns integer |
| modbus.get[endpoint,, , ,,, ,] | Reads modbus data. Returns various types |
| net.dns.record[,name,, ,,] | 执行DNS查询。返回字符串信息 |
| net.dns[,name,,, ,] | 检查 DNS 服务是否开启。返回 0 - DNS 服 务关闭(服务未响应或DNS解析失败);1 - DNS 服务开启 |
| net.if.collisions[if] | 网络冲突数量。返回整型 |
| net.if.discovery | List of network interfaces. Returns JSON |
| net.if.in[if,] | 网络接口上传流量统计。返回 整数 |
| net.if.list | 网络接口列表(包括接口类型,状态,IPv4地 址,说明)。返回文本 |
| net.if.out[if,] | 上行流量统计。返回整数 |
| net.if.total[if,] | 网络接口上传下载的流量总和。返回整数 |
| net.tcp.listen[port] | 检查 TCP 端口 是否处于侦听状态。返回 0 - 未侦听;1 - 正在侦听 |
| net.tcp.port[,port] | 检查是否能建立 TCP 连接到指定端口。返回 0 - 不能连接;1 - 可以连接 |
| net.tcp.service.perf[service,,] | 检查 TCP 服务的性能,当服务 down 时返回 0,否则返回连接服务花费的秒数 |
| net.tcp.service[service,,] | 检查服务是否运行并接受 TCP 连接。返回 0 - 服务关闭;1 - 服务运行 |
| net.tcp.socket.count[,, ,,] | Returns number of TCP sockets that match parameters. Returns integer |
| net.udp.listen[port] | 检查 UDP 端口 是否处于侦听状态。返回 0 - 未侦听;1 - 正在侦听 |
| net.udp.service.perf[service,,] | 检查 UDP 服务的性能,当服务 down 时返回 0,否则返回连接到服务花费的秒数 |
| net.udp.service[service,,] | 检查服务是否运行并响应 UDP 请求。返回 0 - 服务关闭;1 - 服务运行 |
| net.udp.socket.count[,, ,,] | Returns number of UDP sockets that match parameters. Returns integer |
| perf_counter[counter,] | 所有Windows计数器值。返回 整形、浮点、 字符串、文本 |
| perf_counter_en[counter,] | Value of any Windows performance counter in English. Returns integer, float, string or text (depending on the request) |
| perf_instance.discovery[object] | List of object instances of Windows performance counters, discovered using object names in English. Returns JSON |
| proc.cpu.util[,,, ,,] | Process CPU utilization percentage. Returns float |
| proc.mem[,,, ,] | 进程内存,以字节为单位。返回整数 |
| proc.num[,,, ,] | 进程数。返回整数 |
| proc_info[process,,] | 具体处理的各个信息。返回浮点数 |
| sensor[device,sensor,] | 硬件传感器读数。返回浮点型 |
| service.info[service,] | 有关服务的信息。返回整数字段表示状态,启 动状态;字符串 - 以字段作为显示名,路 径,用户; 文本 - 使用字段作为描述; 状态 码:0 - 运行,1 - 暂停,2 - 启动挂起, 3 - 暂停挂起,4 - 继续挂起,5 - 停止挂 起,6 - 停止,7 - 未知,255 - 没有这个 服务;启动码:0 - 自动,1 - 自动延迟,2 - 手动, 3 - 禁用,4 - 未知 |
| services[,,] | 列表服务。返回0表示空,如果是列表则是每行 一个内容 |
| system.boottime | 系统启动时间。返回时间戳 |
| system.cpu.discovery | List of detected CPUs/CPU cores. Returns JSON |
| system.cpu.intr | 设备的中断数。返回整数 |
| system.cpu.load[,] | CPU 负载。返回浮点数 |
| system.cpu.num[] | CPU 数量,返回整数 |
| system.cpu.switches | 上下文的数量进行切换。它返回一个整数值。 |
| system.cpu.util[,,,<logical_or_physical>] | CPU utilization percentage. Returns float |
| system.hostname[,] | 系统主机名。返回字符串 |
| system.hw.chassis[] | 机架信息。返回字符串 |
| system.hw.cpu[,] | CPU 信息。返回字符串或整数 |
| system.hw.devices[] | PCI或者USB设备列表。返回文本 |
| system.hw.macaddr[,] | MAC地址。返回字符串 |
| system.localtime[] | System time. Returns integer with type as UTC; string - with type as local |
| system.run[command,] | 即在主机上指定的命令的执行。返回命令执行 结果的文本值。如果指定NOWAIT的模式,这将 返回执行命令的结果1。 |
| system.stat[resource,] | 系统统计数据。返回整数值或者浮点值 |
| system.sw.arch | 软件架构信息。返回字符串 |
| system.sw.os[] | 操作系统信息。返回字符串 |
| system.sw.packages[, ,] | 安装包列表。返回文本 |
| system.swap.in[,] | 在交换分区(swap)(从设备到内存)统计数 据。返回整数 |
| system.swap.out[,] | 交换分区(从内存到设备)的统计数据。返回 整数 |
| system.swap.size[,] | 交换分区空间大小,字节或从总百分比。从字 节返回整数;对于浮动比例 |
| system.uname | 识别系统。返回 字符串 |
| system.uptime | 系统启动时间。返回整数 |
| system.users.num | 已登录的用户数量,返回整数 |
| vfs.dev.discovery | List of block devices and their type. Returns JSON |
| vfs.dev.read[,,] | 磁盘读取数据。类型是sectors, operations, bytes;返回整数,类型是 sps, ops, bps则返回浮点。 |
| vfs.dev.write[,,] | 磁盘写入数据。类型是sectors, operations, bytes;返回整数,类型是 sps, ops, bps则返回浮点。 |
| vfs.dir.count[dir,<regex_incl>, | 目录递归的条目数量。返回整数 |
| vfs.dir.get[dir,<regex_incl>, <regex_excl>,<types_incl>, <types_excl>,<max_depth>, <min_size>, <max_size>,<min_age>,<max_age>, <regex_excl_dir | List of directory entries, recursively. Returns JSON |
| vfs.dir.size[dir,<regex_incl>, <regex_excl>,,<max_depth>, <regex_excl_dir | 目录大小(bytes)。返回整数 |
| vfs.file.cksum[file,] | File checksum, calculated by the UNIX cksum algorithm. Returns integer for crc32 (default) and string for md5, sha256 |
| vfs.file.contents[file,] | 搜索文件内容。返回文本 |
| vfs.file.exists[file,<types_incl>, <types_excl | Checks if file exists. Returns 0 - not found; 1 - file of the specified type exists |
| vfs.file.get[file] | Information about a file. Returns JSON |
| vfs.file.md5sum[file] | 文件的MD5校验。返回字符串(该文件的MD5哈 希值) |
| vfs.file.md5sum[file] | File owner information. Returns string |
| vfs.file.permissions[file] | Returns 4-digit string containing octal number with Unix permissions |
| vfs.file.regexp[file,regexp,, | line>,,] 查找文件中的字符串,返回内容是 被匹配内容的整行字符串,或者其他可选参数 |
| vfs.file.regmatch[file,regexp,, | line>,] 查找文件中的字符串,如果有则返 回1,没有则返回0。 |
| vfs.file.size[file,] | File size in bytes (default) or in newlines. Returns integer |
| vfs.file.time[file,] | 文件事件信息,返回的是时间戳 整数 |
| vfs.fs.discovery | List of mounted filesystems and their types. Returns JSON |
| vfs.fs.get | List of mounted filesystems, their types, disk space and inode statistics. Returns JSON |
| vfs.fs.inode[fs,] | 数或inode的百分比。返回数字,如果是浮点 则是百分比 |
| vfs.fs.size[fs,] | 磁盘容量。如果返回的是字节则是整数,如果 返回的是百分比则是浮点 |
| vm.memory.size[] | 从字节或总百分比的内存大小。它返回一个整 数值,如果字节,只要百分比返回浮点值。 |
| vm.vmemory.size[] | 虚拟空间大小(以字节计)或百分比(总 计)。 返回整型字节; 浮点百分比 |
| web.page.get[host,,] | 获取网页。返回信息为网页源码或者TXT |
| web.page.perf[host,,] | 全网页加载时间(秒)。返回浮点型 |
| web.page.regexp[host,, ,regexp,,] | 查找网页中的字符串,返回内容是被匹配内容 的整行字符串,或者其他可选参数 |
| wmi.get[,] | 执行 WMI 查询返回第一个对象。返回整形、 浮点、字符串或者文本内容 |
| wmi.getall[,] | Execute WMI query and return the JSON document with all selected objects |
| zabbix.stats[,,queue,,] | Number of items in the queue which are delayed in Zabbix server or proxy by "from" till "to" seconds, inclusive. |
| zabbix.stats[,] | Returns a JSON object containing Zabbix server or proxy internal metrics. |
2.触发器函数
| 函数 | 说明 |
|---|---|
| 对比与比较 | |
| last() | 最近值 (最新的值) |
| nodata() | 是否有数据 |
| diff() | 是否发生变化 一般配合md5check() |
| 进行计算 | |
| avg() | 平均值 |
| min() | 最小值 |
| max() | 最大值 |
自定义监控案例
监控Nginx网站
1.通过命令或脚本取出对应的值
#判断80端口是否存在,值为0不存在,其它数字则是存在
[root@90 ~]# ss -tnl | grep :80 |wc -l
0
[root@90 ~]# systemctl  start nginx
[root@90 ~]# ss -tnl | grep :80 |wc -l
2
2.创建键值
##模板:
UserParameter=key,cmd
UserParameter=固定写法,表示要自定义键值 key表示键值名字,命名最好就是 单词+"." (点)
cmd表示命令或脚本

[root@90 ~]# vim /etc/zabbix/zabbix_agent2.d/web.conf
UserParameter=check.ngx,ss -tnl | grep :80 |wc -l
[root@90 ~]#systemctl restart zabbix_agent2
[root@90 ~]# zabbix_agent2 -t check.ngx
check.ngx                                     [s|2]
[root@90 ~]# systemctl  stop nginx
[root@90 ~]# zabbix_agent2 -t check.ngx
check.ngx                                     [s|0]
#s表示类型 0是键值的结果
3.服务端手动测试
#需要借助zabbix-get工具获取指定键值的数据
-s  客户端ip地址
-p  客户端端口号默认10050
-k  指定键值
[root@Zabbix ~]# yum -y install zabbix-get
[root@Zabbix ~]# zabbix_get -s 10.10.10.90 -p 10050 -k check.ngx
0
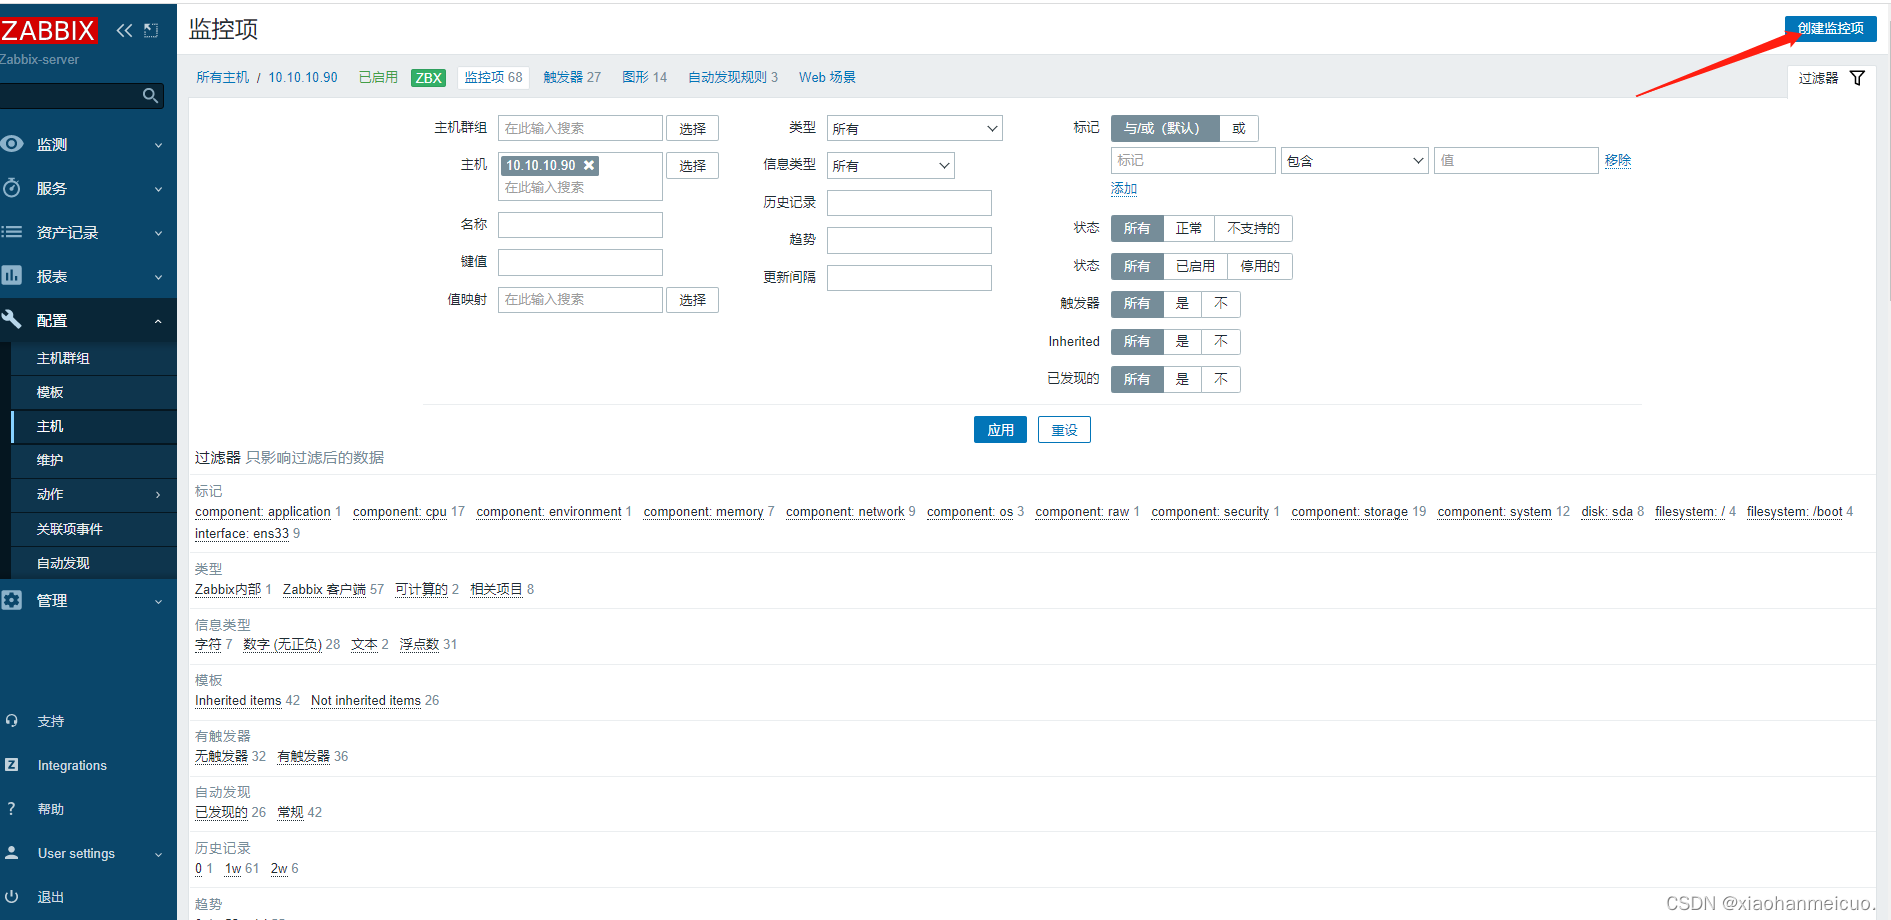
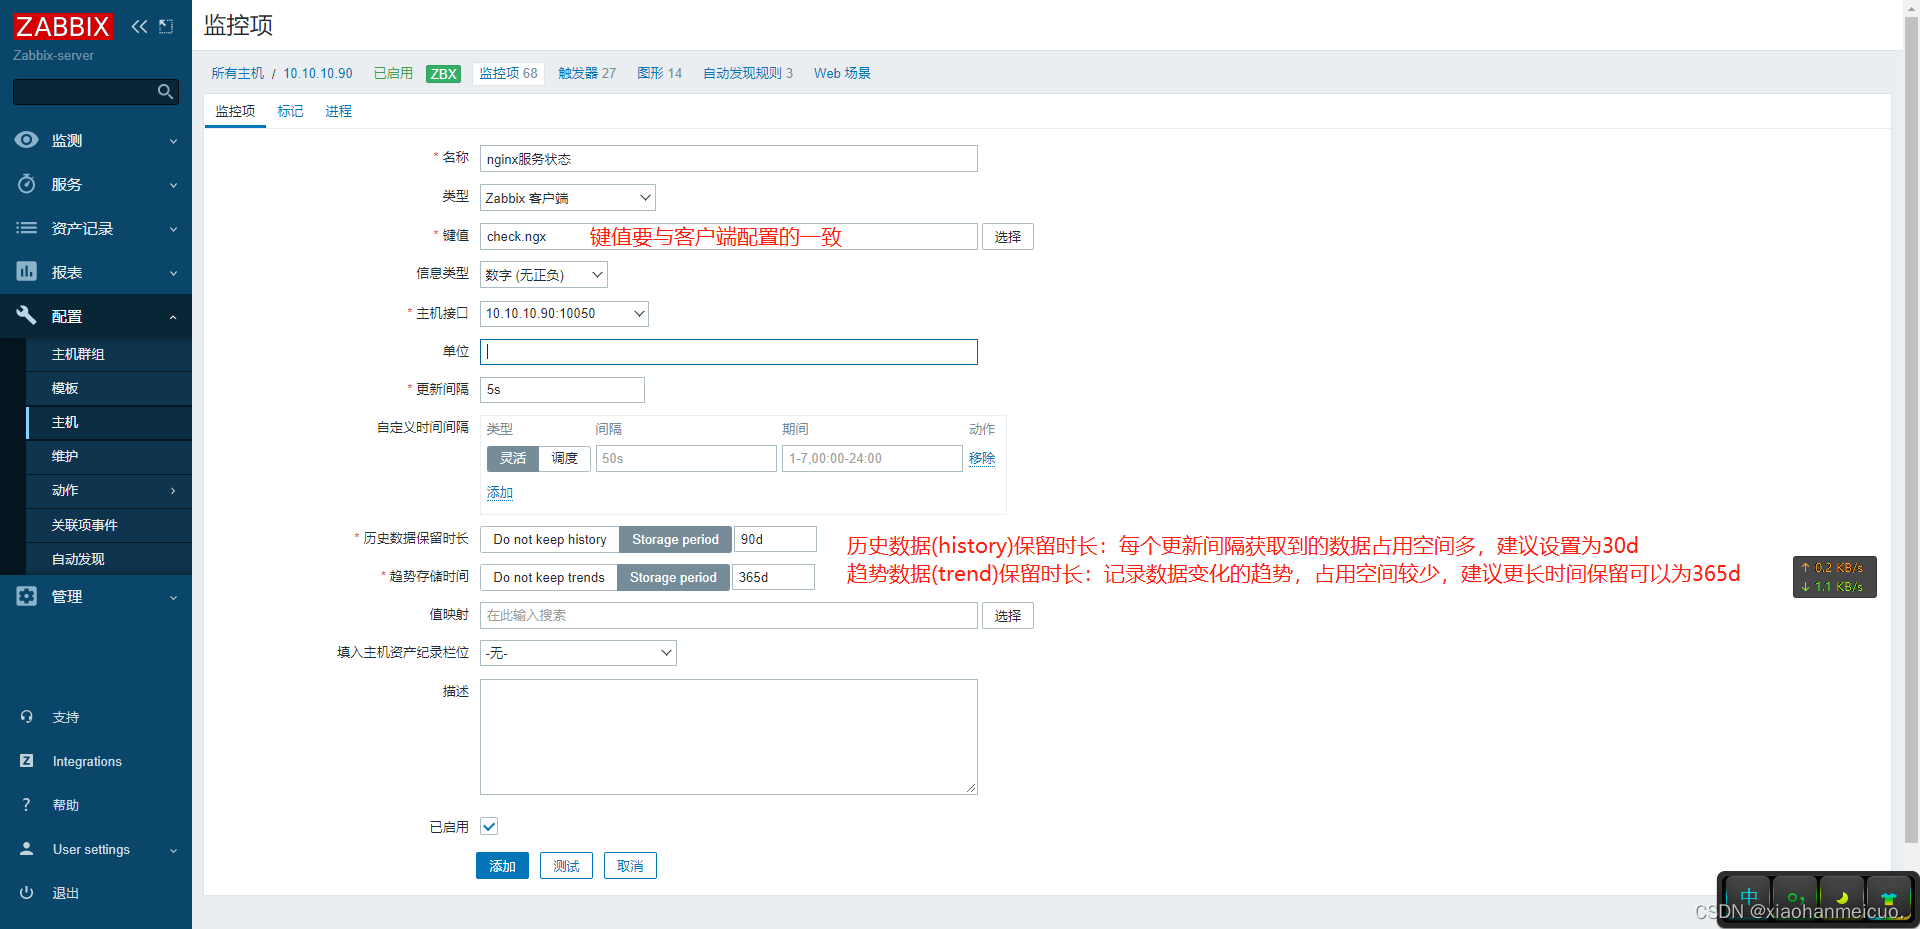
4.web页面创建监控项,把客户端创建的键值与服务端监控项关联起来
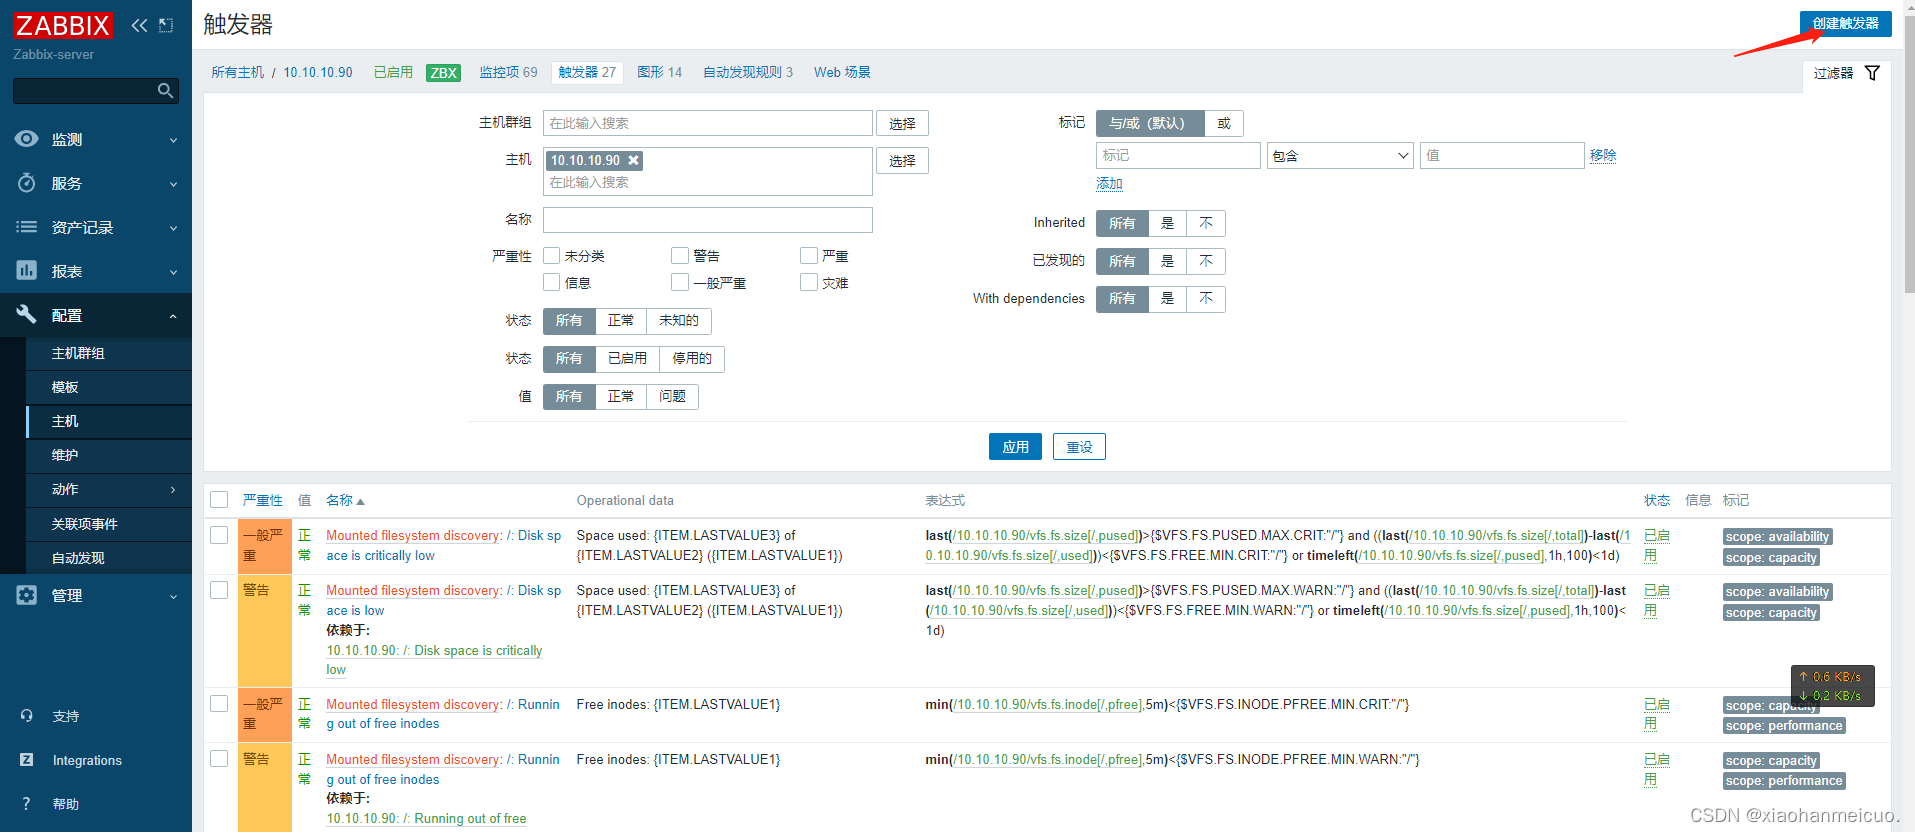
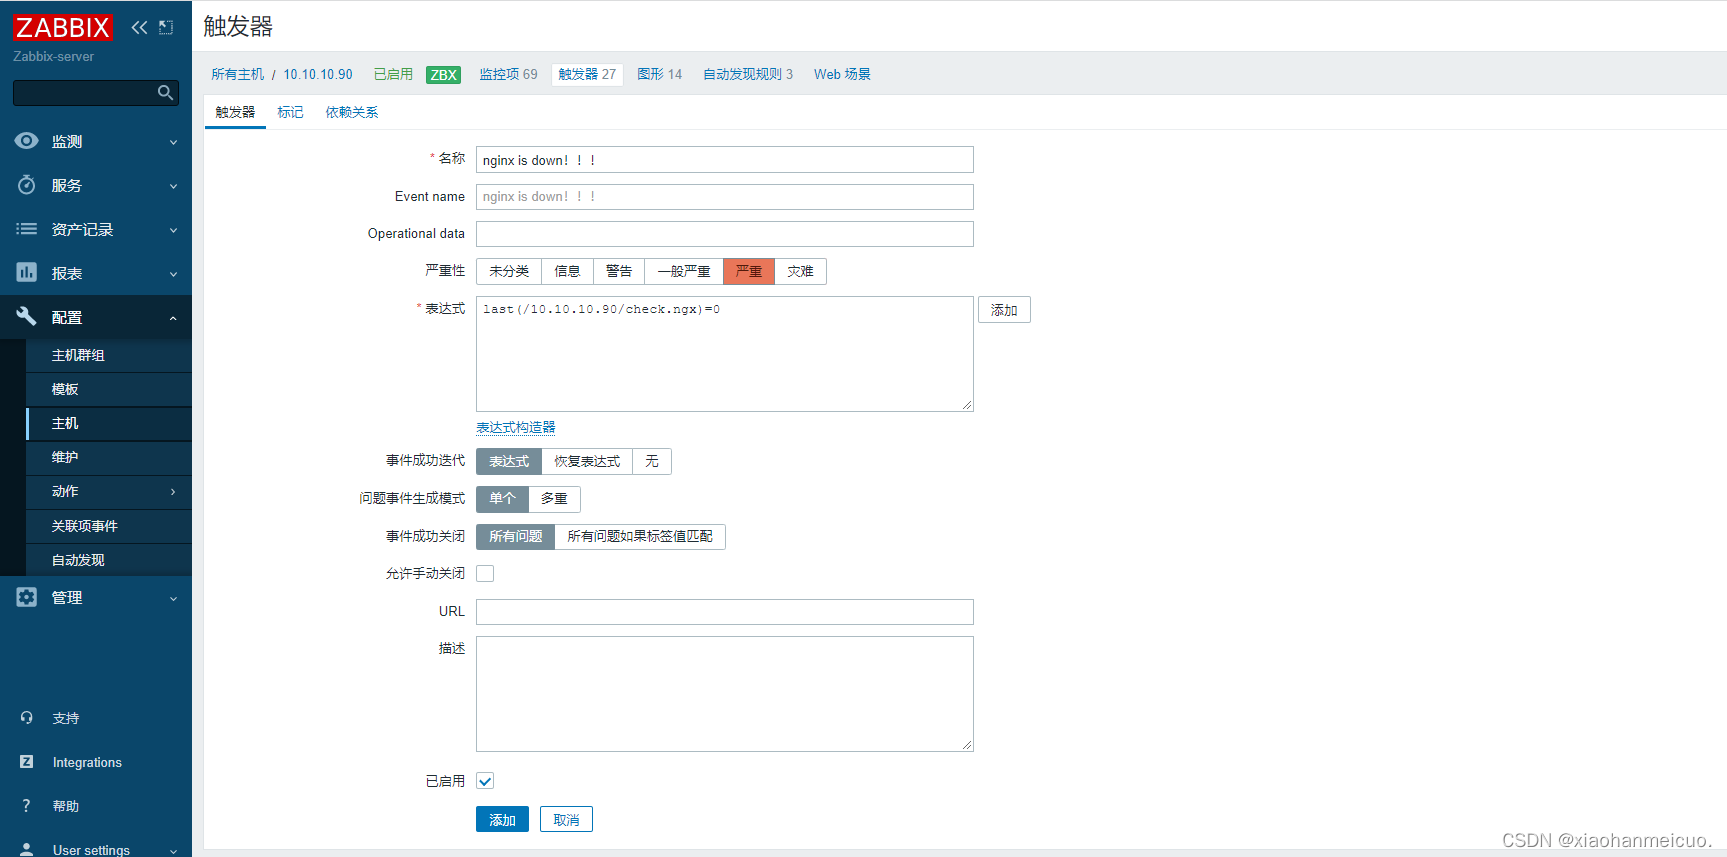
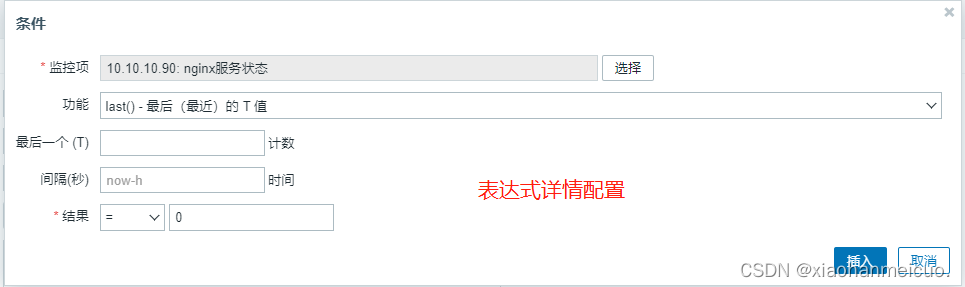
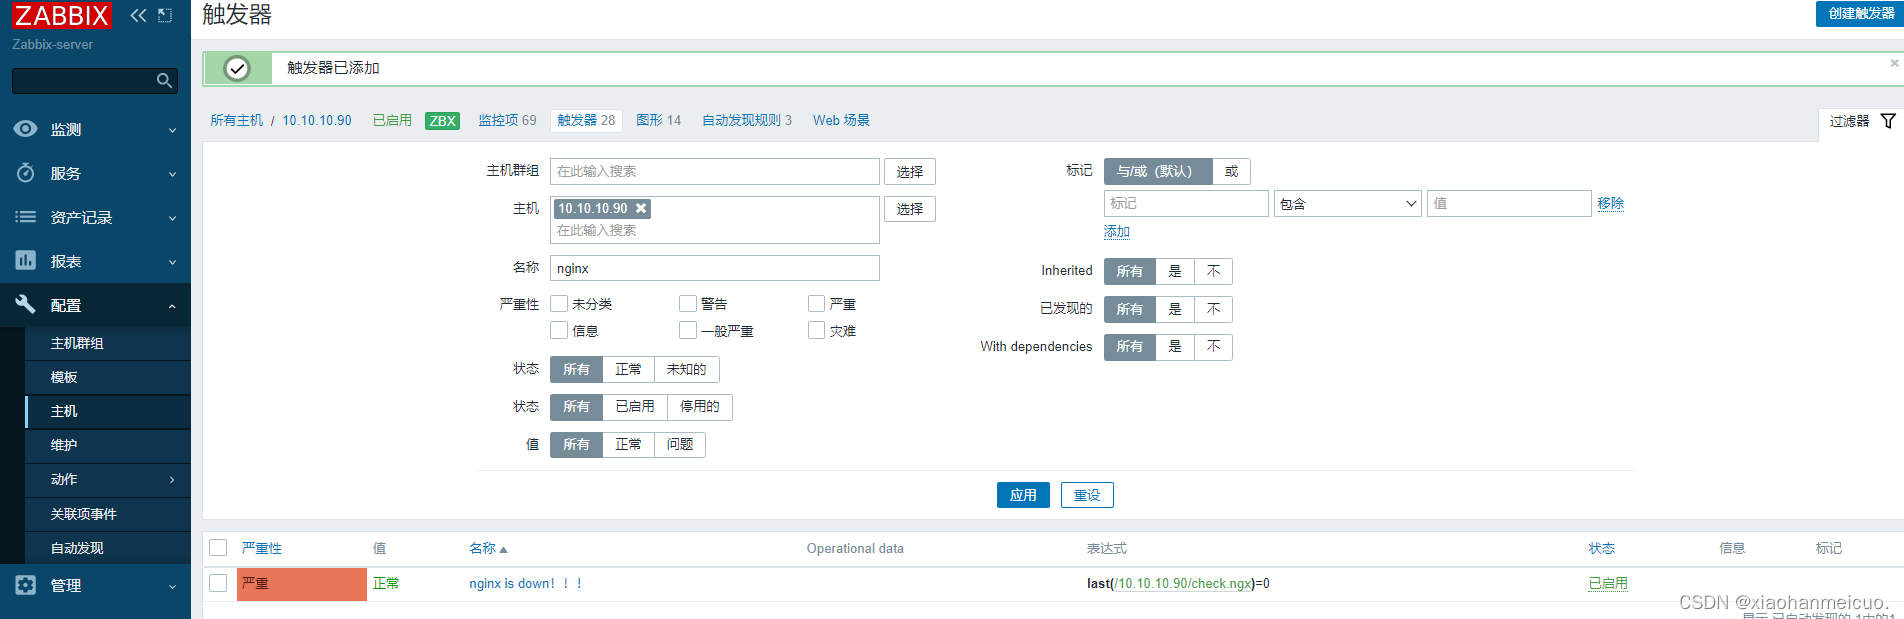
5.触发器,根据监控项获取的数值内容,决定触发等级
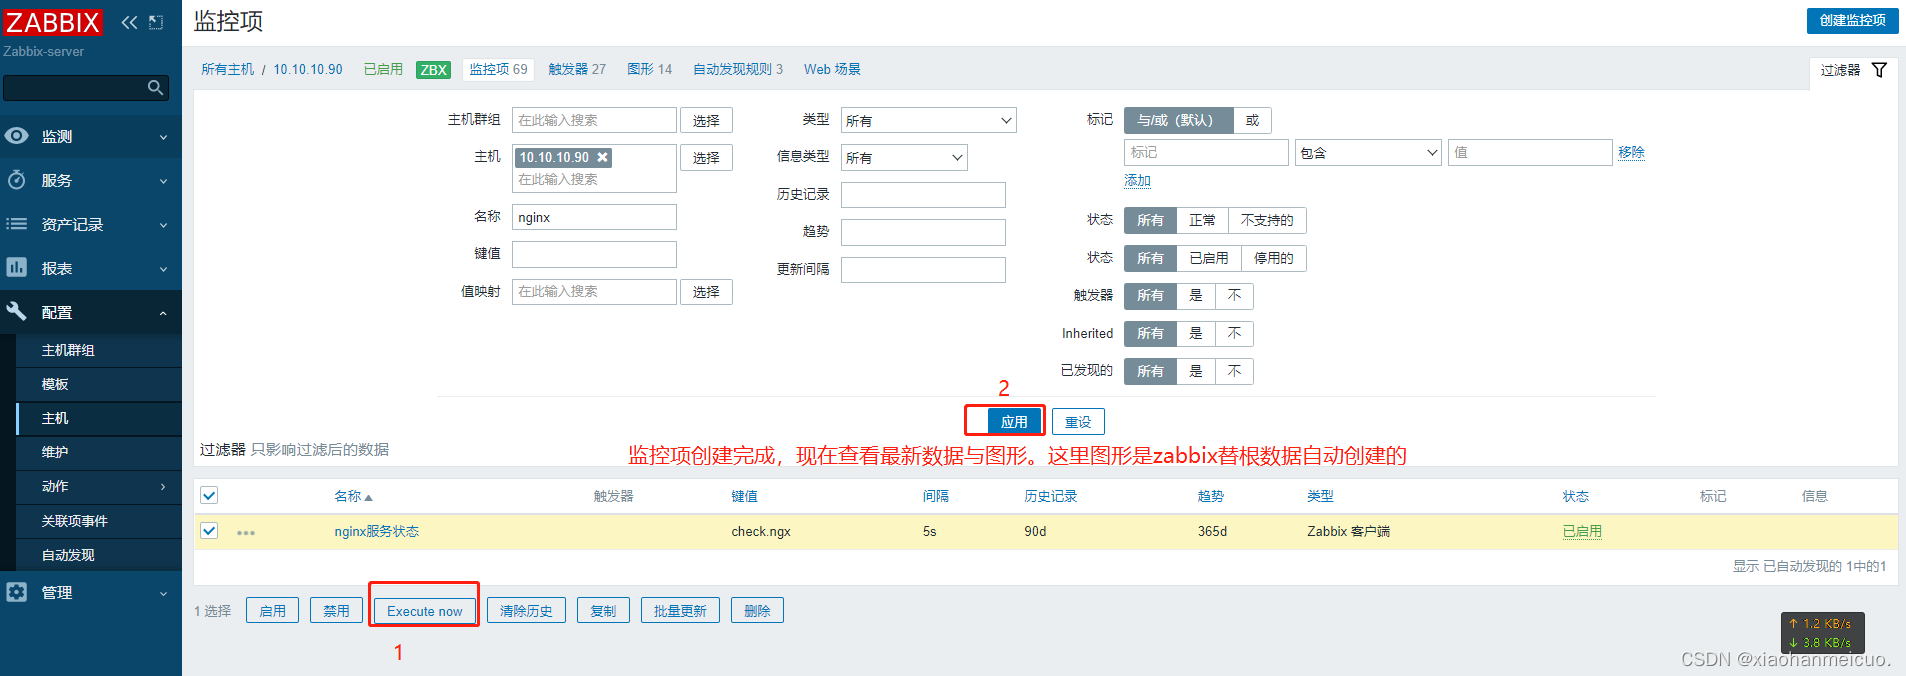
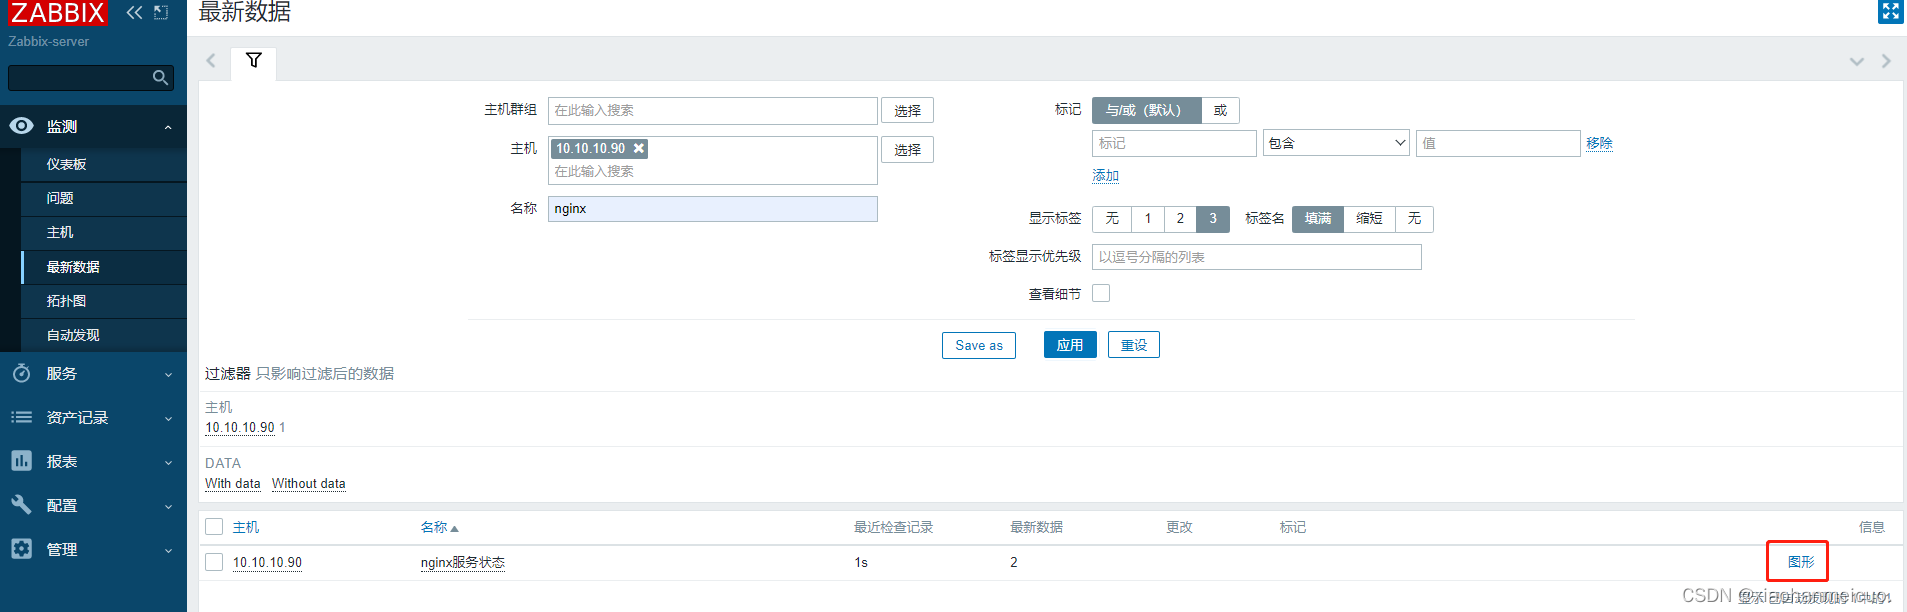
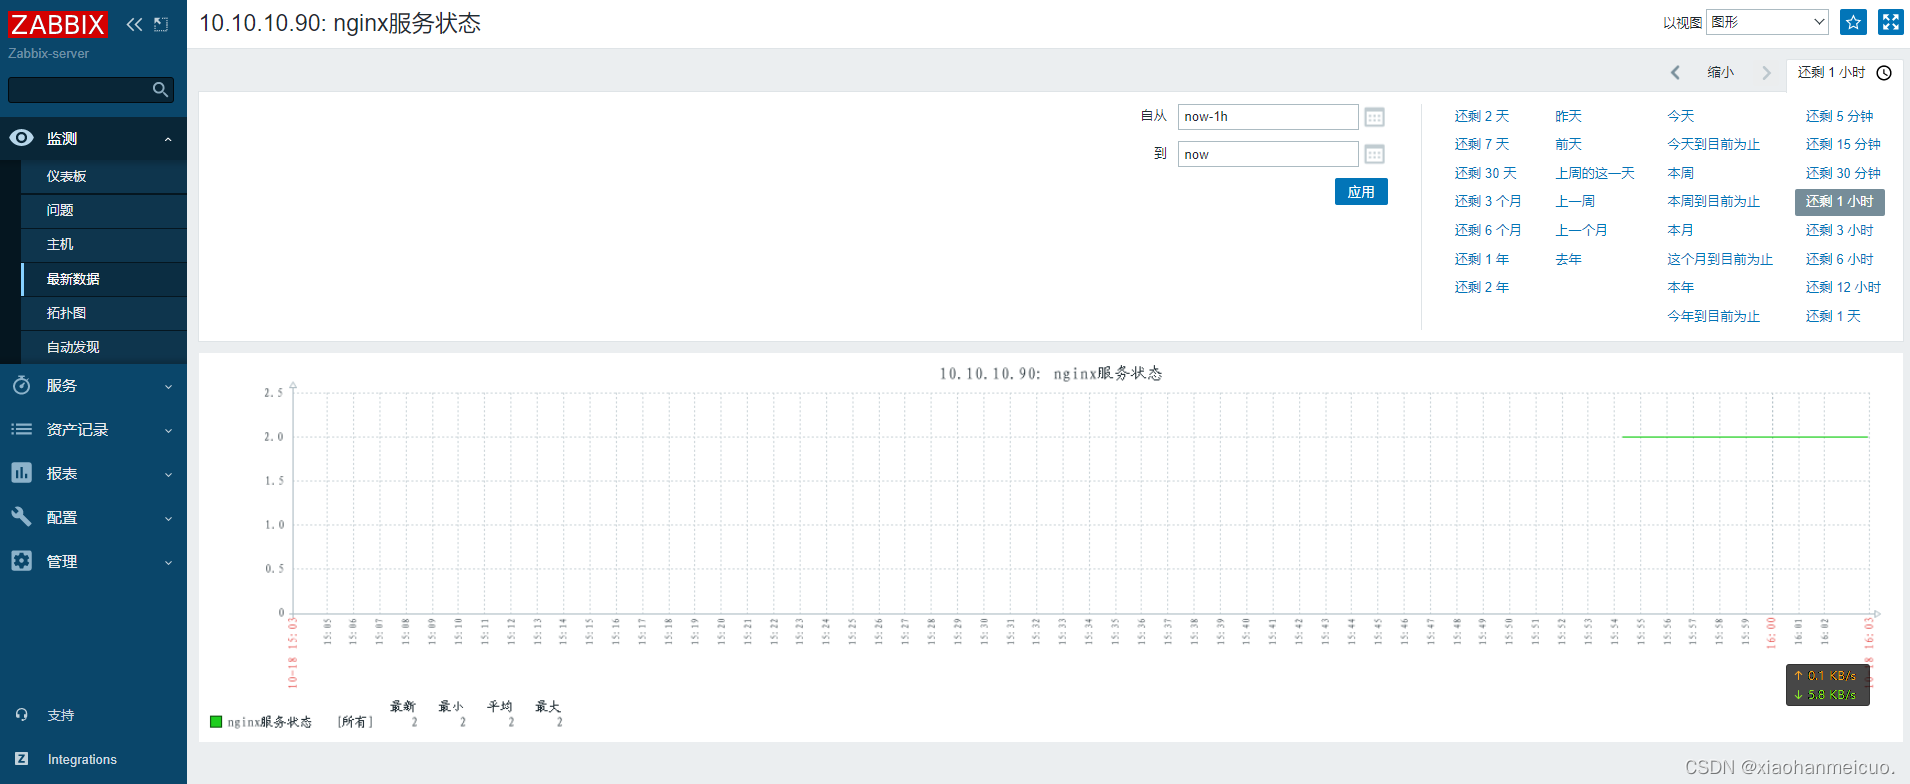
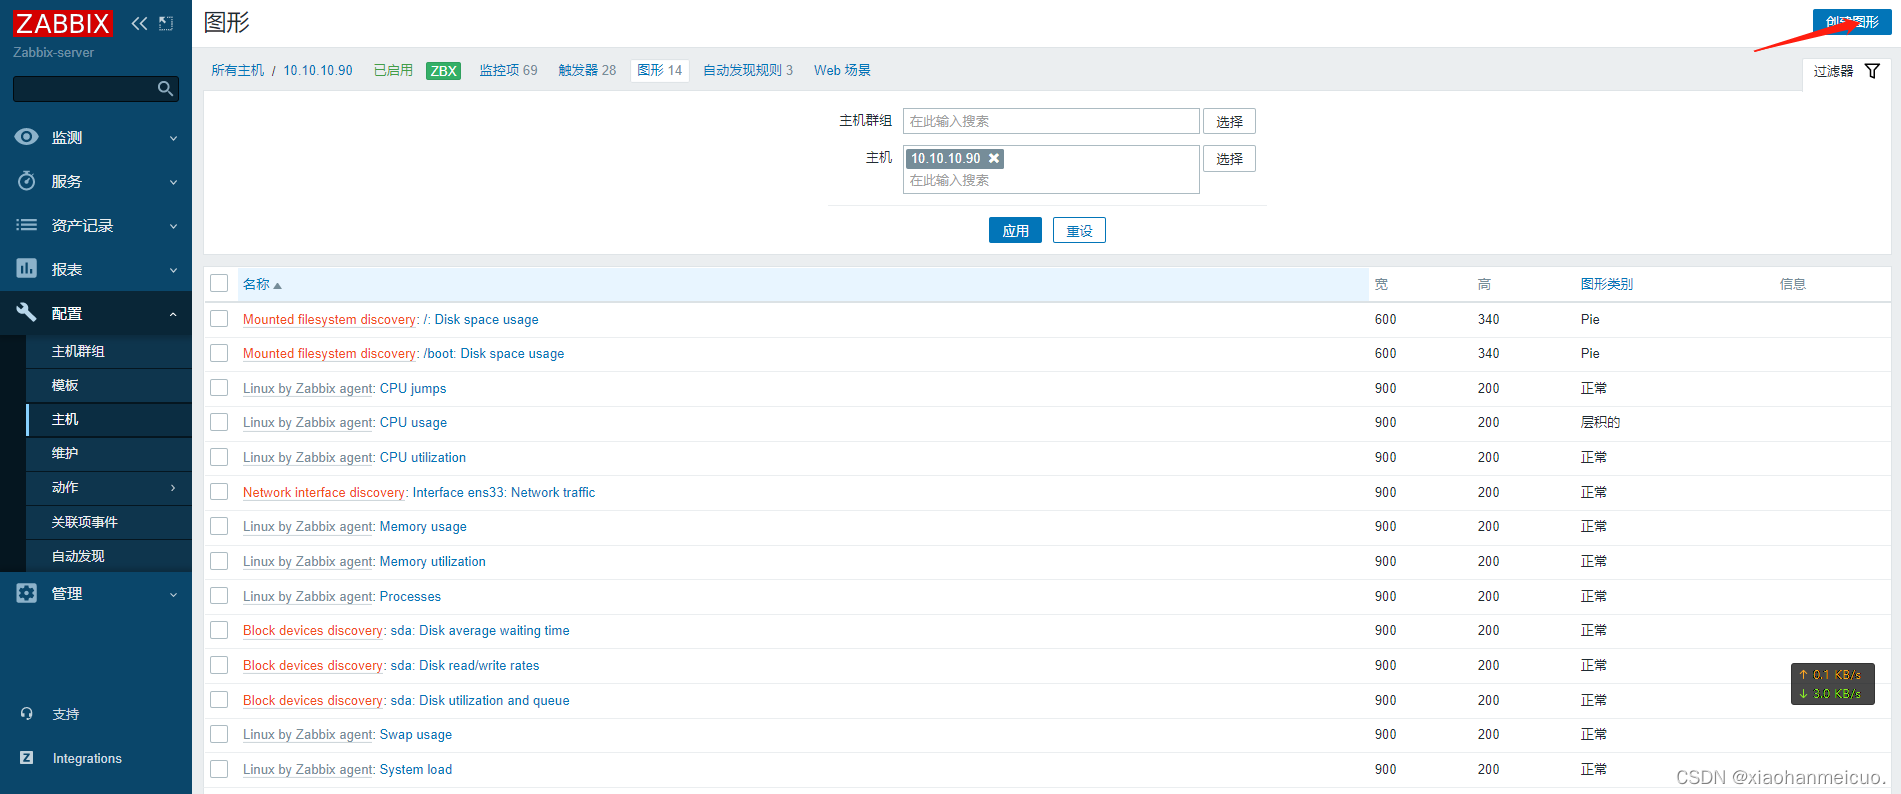
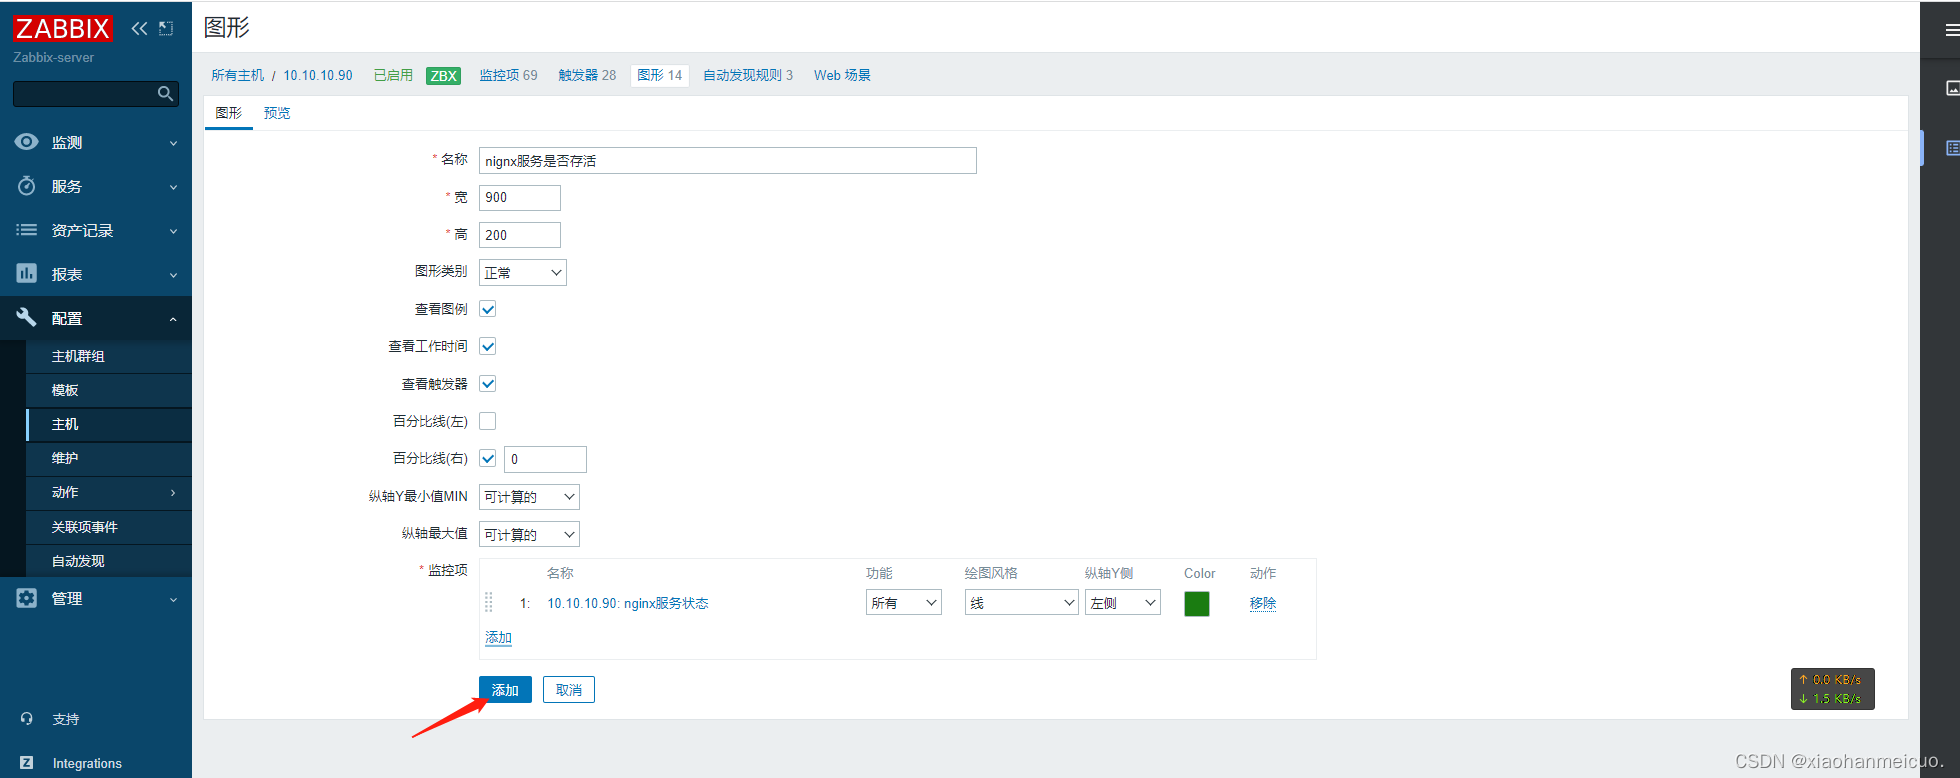
6.web页面添加图形
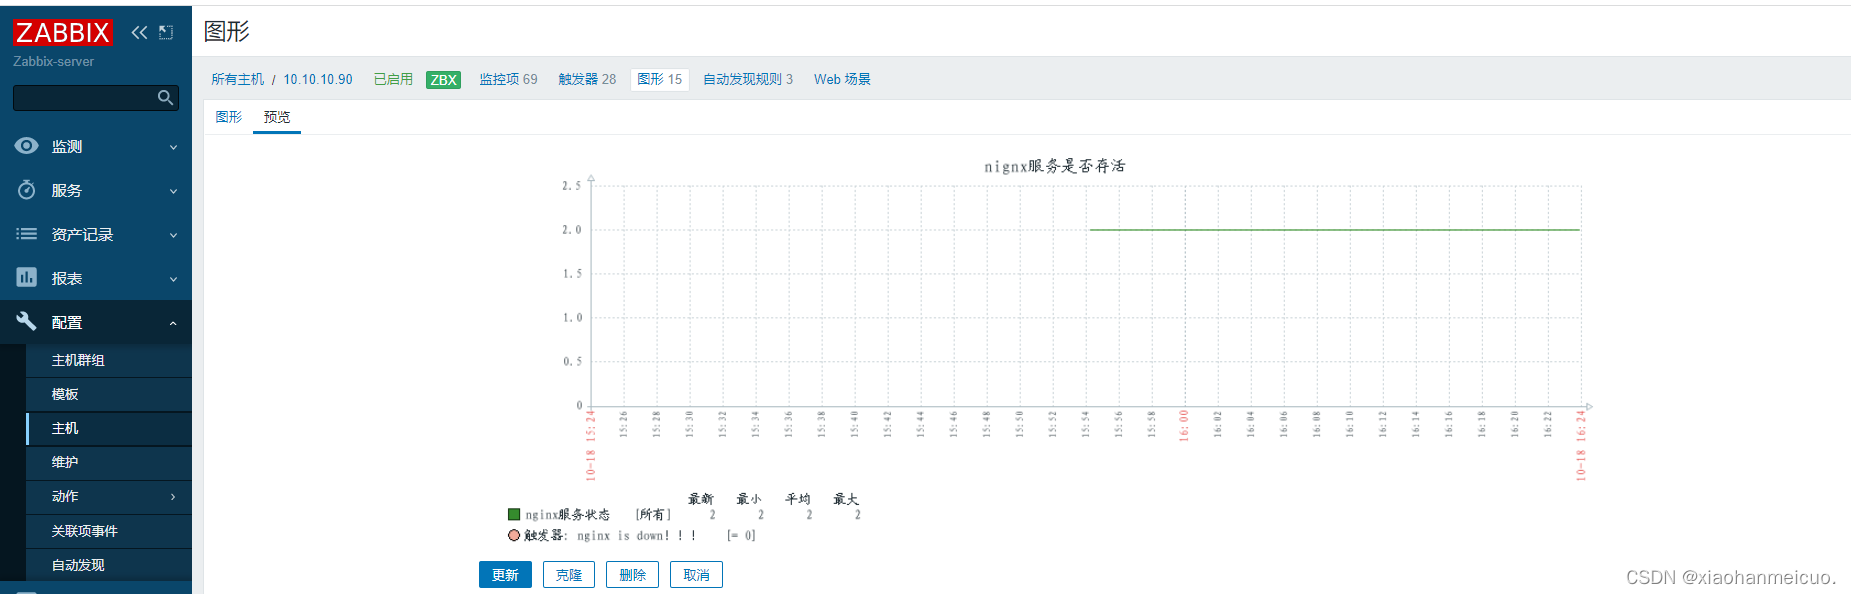
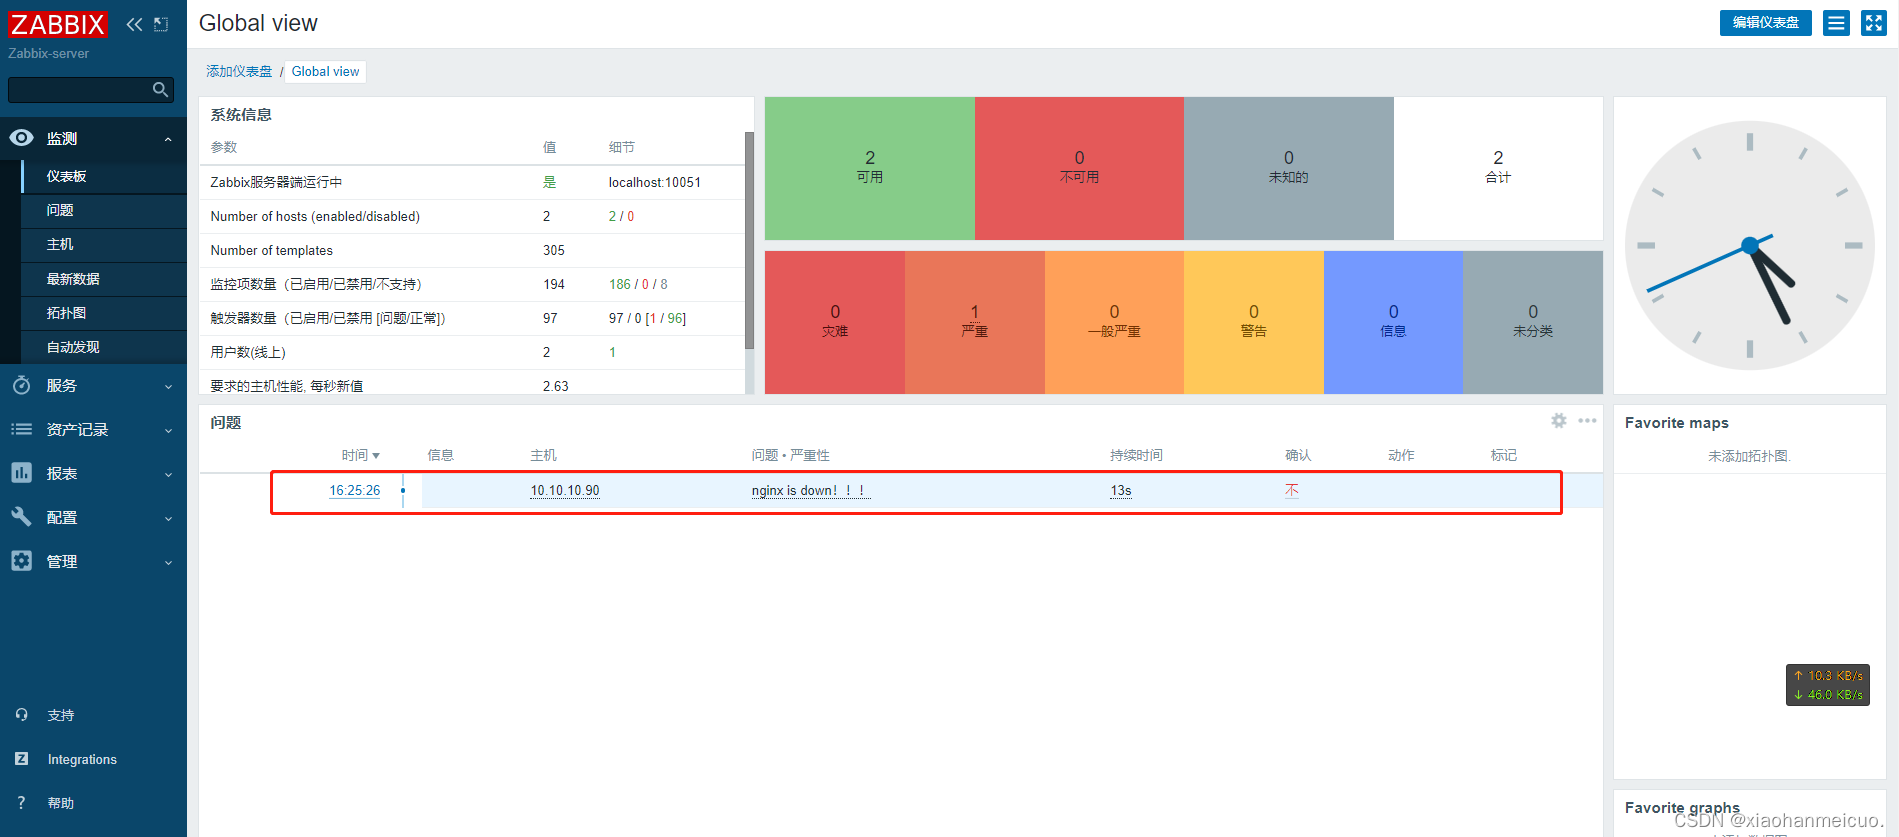
7.测试触发器,模拟nginx挂掉
[root@90 ~]# systemctl stop nginx
监控数据库重要指标
1.编写Shell脚本获取想要的数据库指标
[root@90 ~]# cd /etc/zabbix/zabbix_agent2.d/
[root@90 zabbix_agent2.d]# vim mysql.sh
#!/bin/bash

# 用户名
MYSQL_USER='root'

# 密码
MYSQL_PWD='123456'

# 主机地址/IP
MYSQL_HOST='localhost'

# 端口
MYSQL_PORT='3306'

# 数据连接
MYSQL_CONN="/usr/bin/mysqladmin -u${MYSQL_USER} -p${MYSQL_PWD} -h${MYSQL_HOST} -P${MYSQL_PORT}"

# 参数是否正确
if [ $# -ne "1" ];then
    echo "arg error!"
fi

# 获取数据
case $1 in
    Uptime)
        result=`${MYSQL_CONN} status|cut -f2 -d":"|cut -f1 -d"T"`
        echo $result
        ;;
    Com_update)
        result=`${MYSQL_CONN} extended-status |grep -w "Com_update"|cut -d"|" -f3`
        echo $result
        ;;
    Slow_queries)
        result=`${MYSQL_CONN} status |cut -f5 -d":"|cut -f1 -d"O"`
        echo $result
        ;;
    Com_select)
        result=`${MYSQL_CONN} extended-status |grep -w "Com_select"|cut -d"|" -f3`
        echo $result
                ;;
    Com_rollback)
        result=`${MYSQL_CONN} extended-status |grep -w "Com_rollback"|cut -d"|" -f3`
                echo $result
                ;;
    Questions)
        result=`${MYSQL_CONN} status|cut -f4 -d":"|cut -f1 -d"S"`
                echo $result
                ;;
    Com_insert)
        result=`${MYSQL_CONN} extended-status |grep -w "Com_insert"|cut -d"|" -f3`
                echo $result
                ;;
    Com_delete)
        result=`${MYSQL_CONN} extended-status |grep -w "Com_delete"|cut -d"|" -f3`
                echo $result
                ;;
    Com_commit)
        result=`${MYSQL_CONN} extended-status |grep -w "Com_commit"|cut -d"|" -f3`
                echo $result
                ;;
    Bytes_sent)
        result=`${MYSQL_CONN} extended-status |grep -w "Bytes_sent" |cut -d"|" -f3`
                echo $result
                ;;
    Bytes_received)
        result=`${MYSQL_CONN} extended-status |grep -w "Bytes_received" |cut -d"|" -f3`
                echo $result
                ;;
    Com_begin)
        result=`${MYSQL_CONN} extended-status |grep -w "Com_begin"|cut -d"|" -f3`
                echo $result
                ;;

        *)
        echo "Usage:$0(Uptime|Com_update|Slow_queries|Com_select|Com_rollback|Questions|Com_insert|Com_delete|Com_commit|Bytes_sent|Bytes_received|Com_begin)"
        ;;
esac

[root@90 zabbix_agent2.d]# chmod +x mysql.sh
[root@90 zabbix_agent2.d]# sh mysql.sh Uptime
75799
2.创建键值
[root@90 zabbix_agent2.d]# vim mysql.conf
UserParameter=mysql.status[*],/etc/zabbix/zabbix_agent2.d/mysql.sh $1
3.手动服务端测试(由于指标比较多,这里我只测试个别。)
[root@Zabbix ~]# zabbix_get -s 10.10.10.90 -p 10050 -k mysql.status[Uptime]
76418
[root@Zabbix ~]# zabbix_get -s 10.10.10.90 -p 10050 -k mysql.status[Com_update]
0
[root@Zabbix ~]# zabbix_get -s 10.10.10.90 -p 10050 -k mysql.status[Bytes_sent]
49204
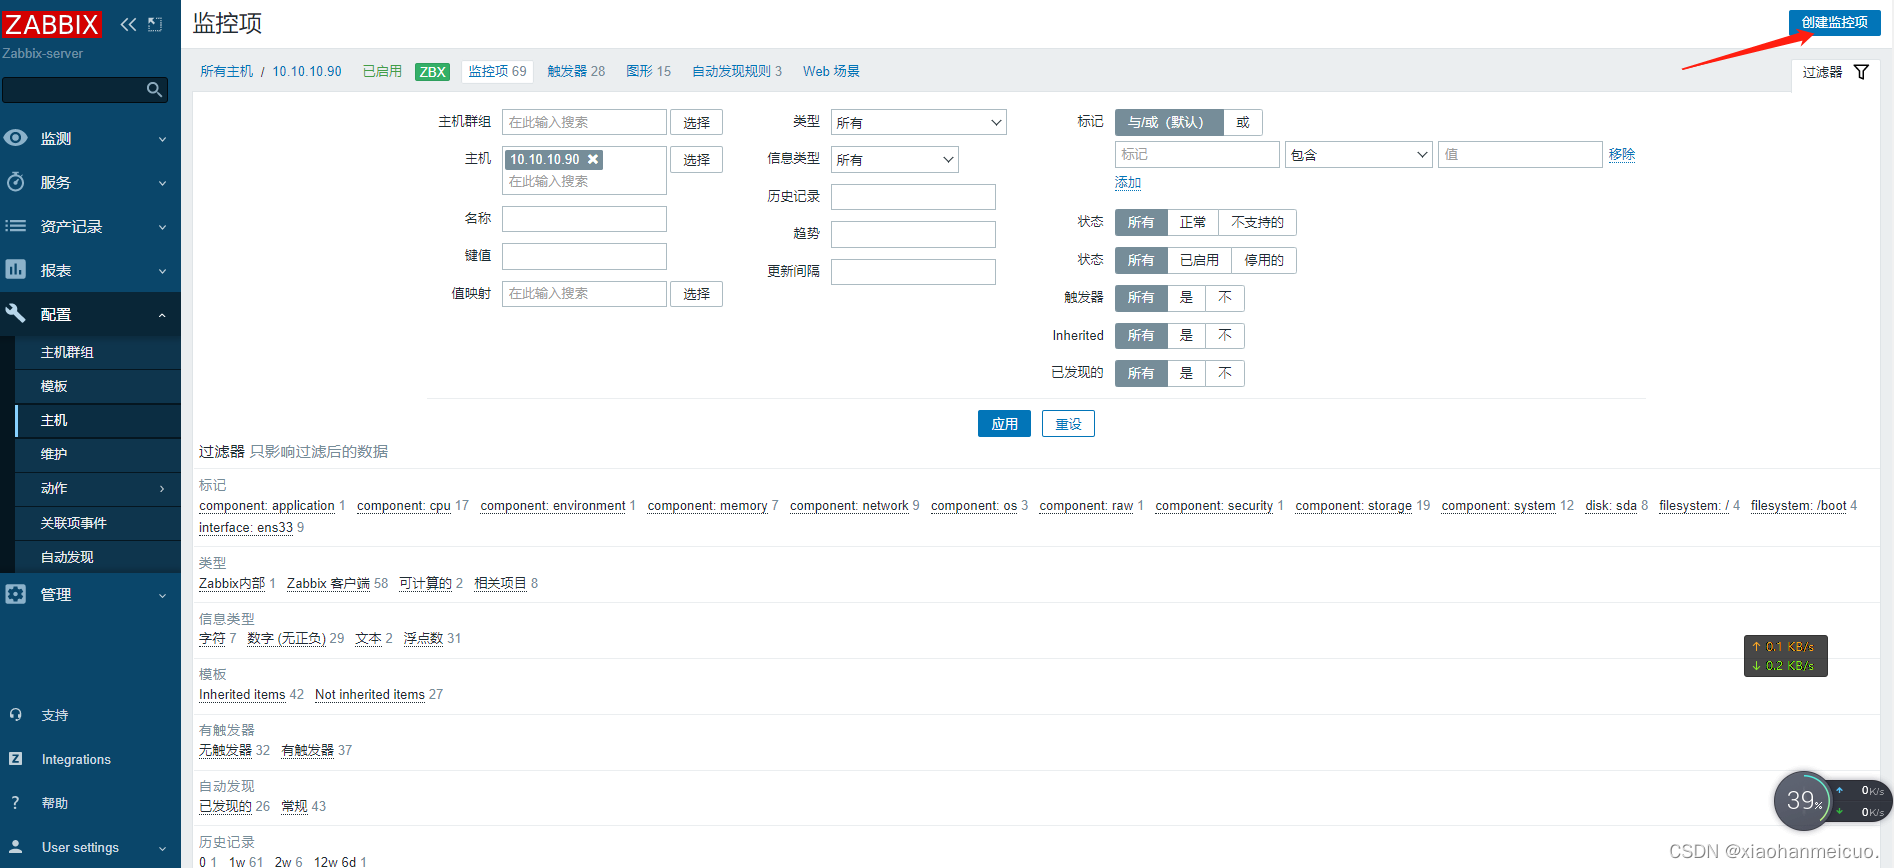
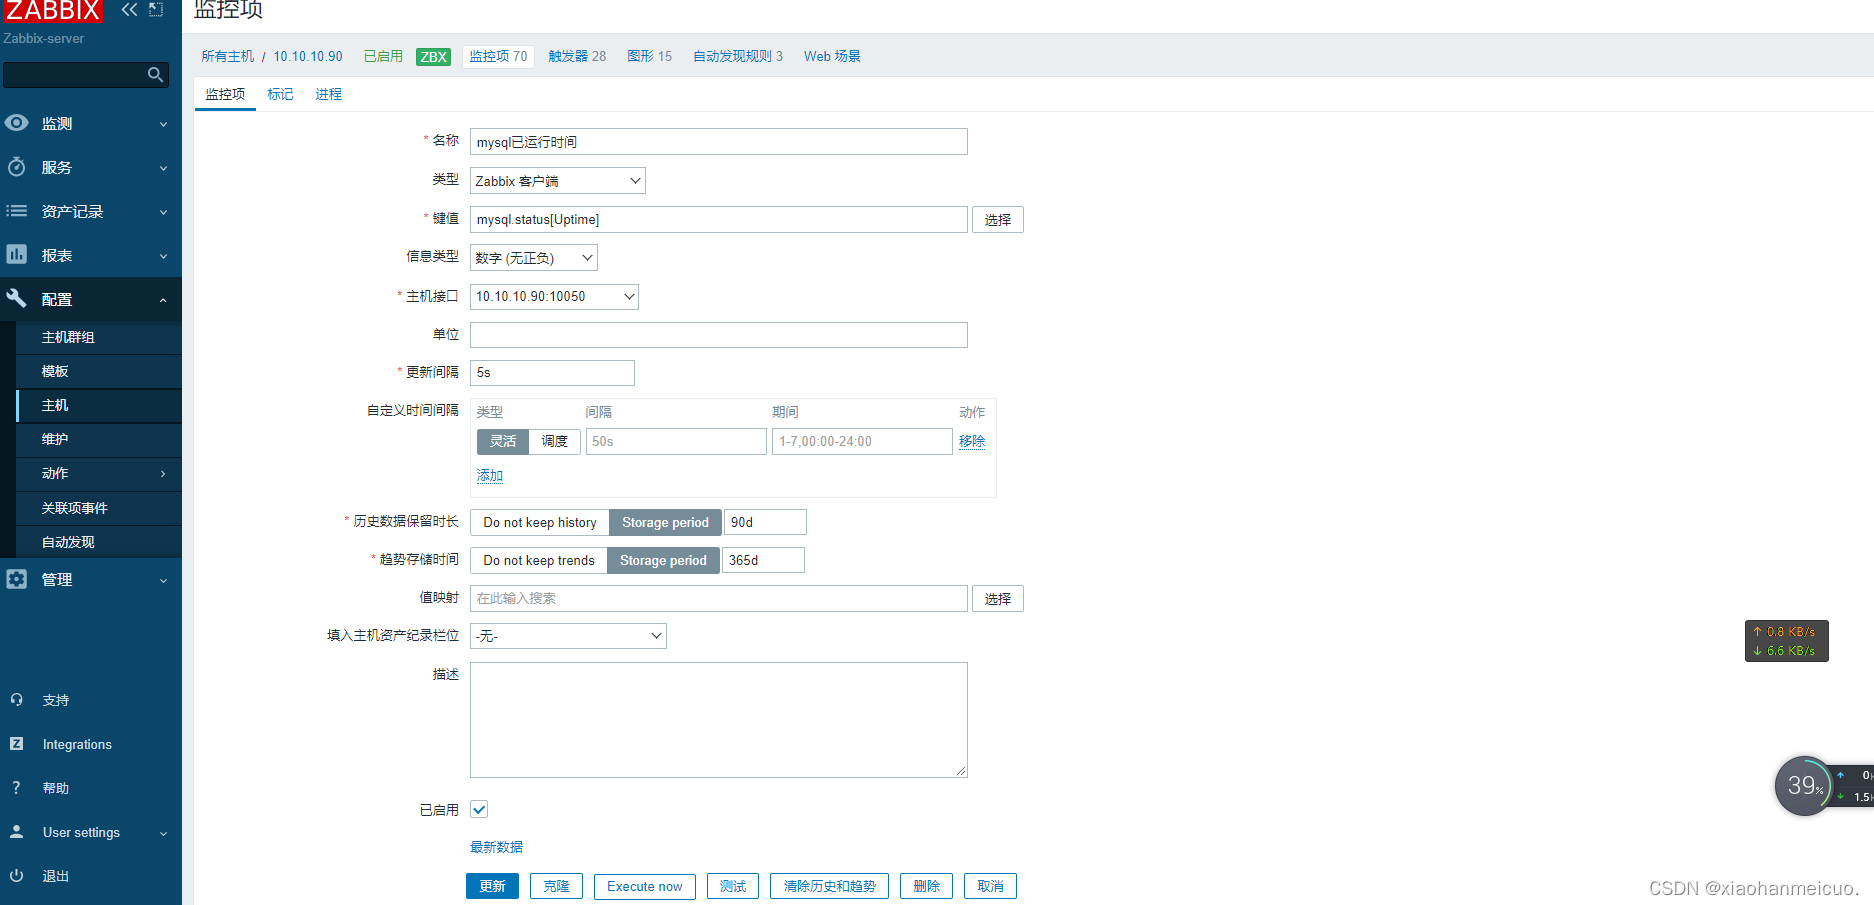
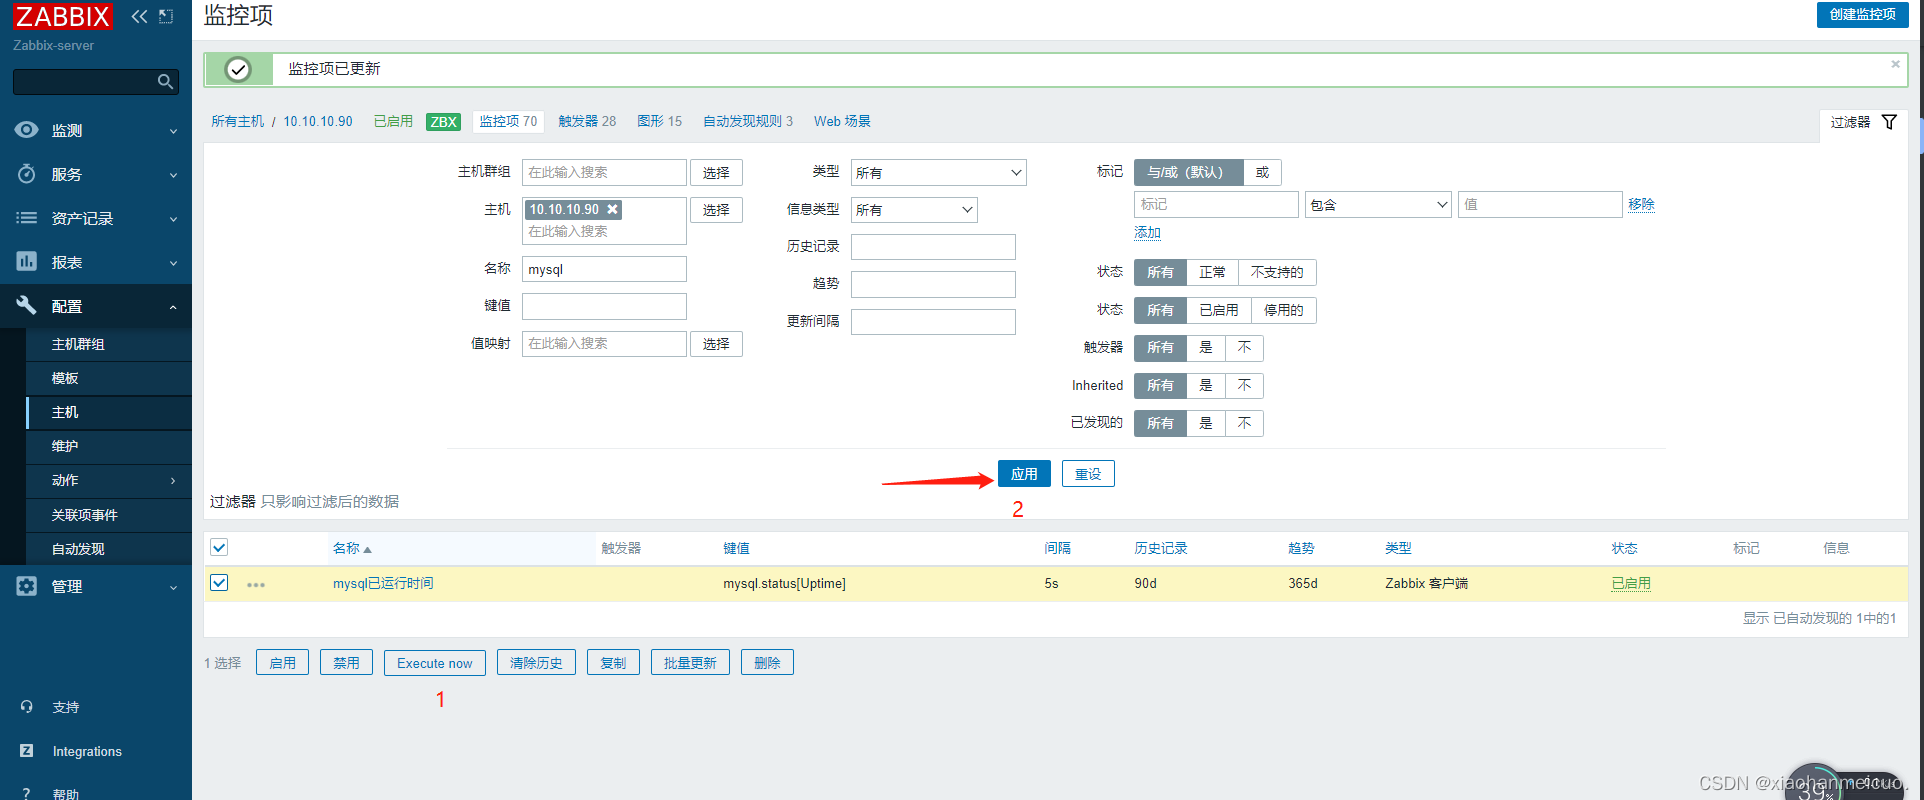
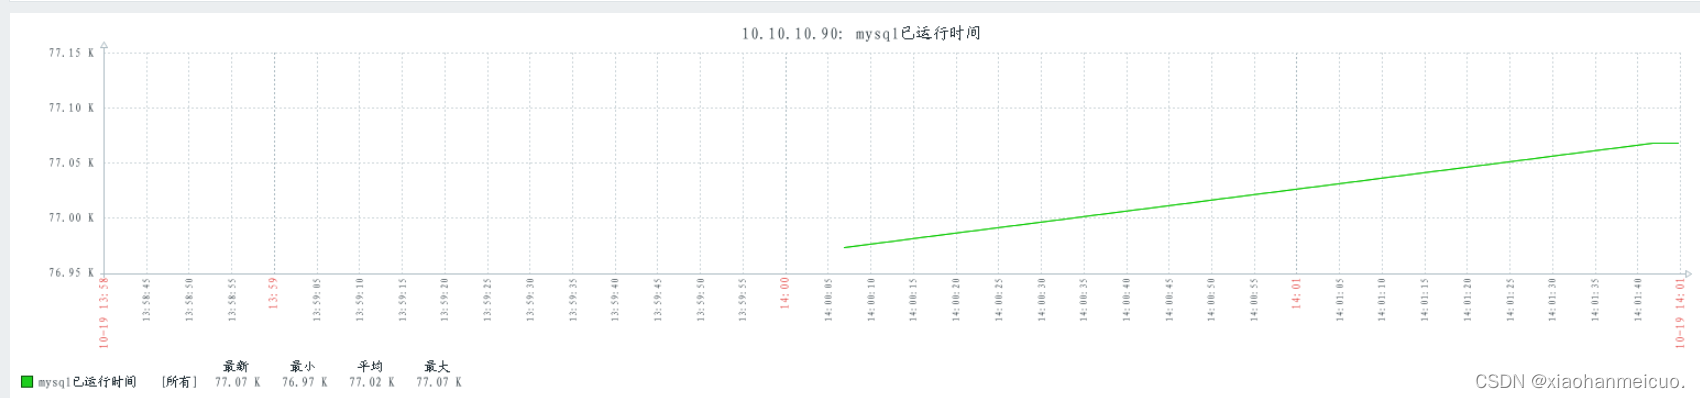
4.web页面创建监控项,把客户端创建的键值与服务端监控项关联起来
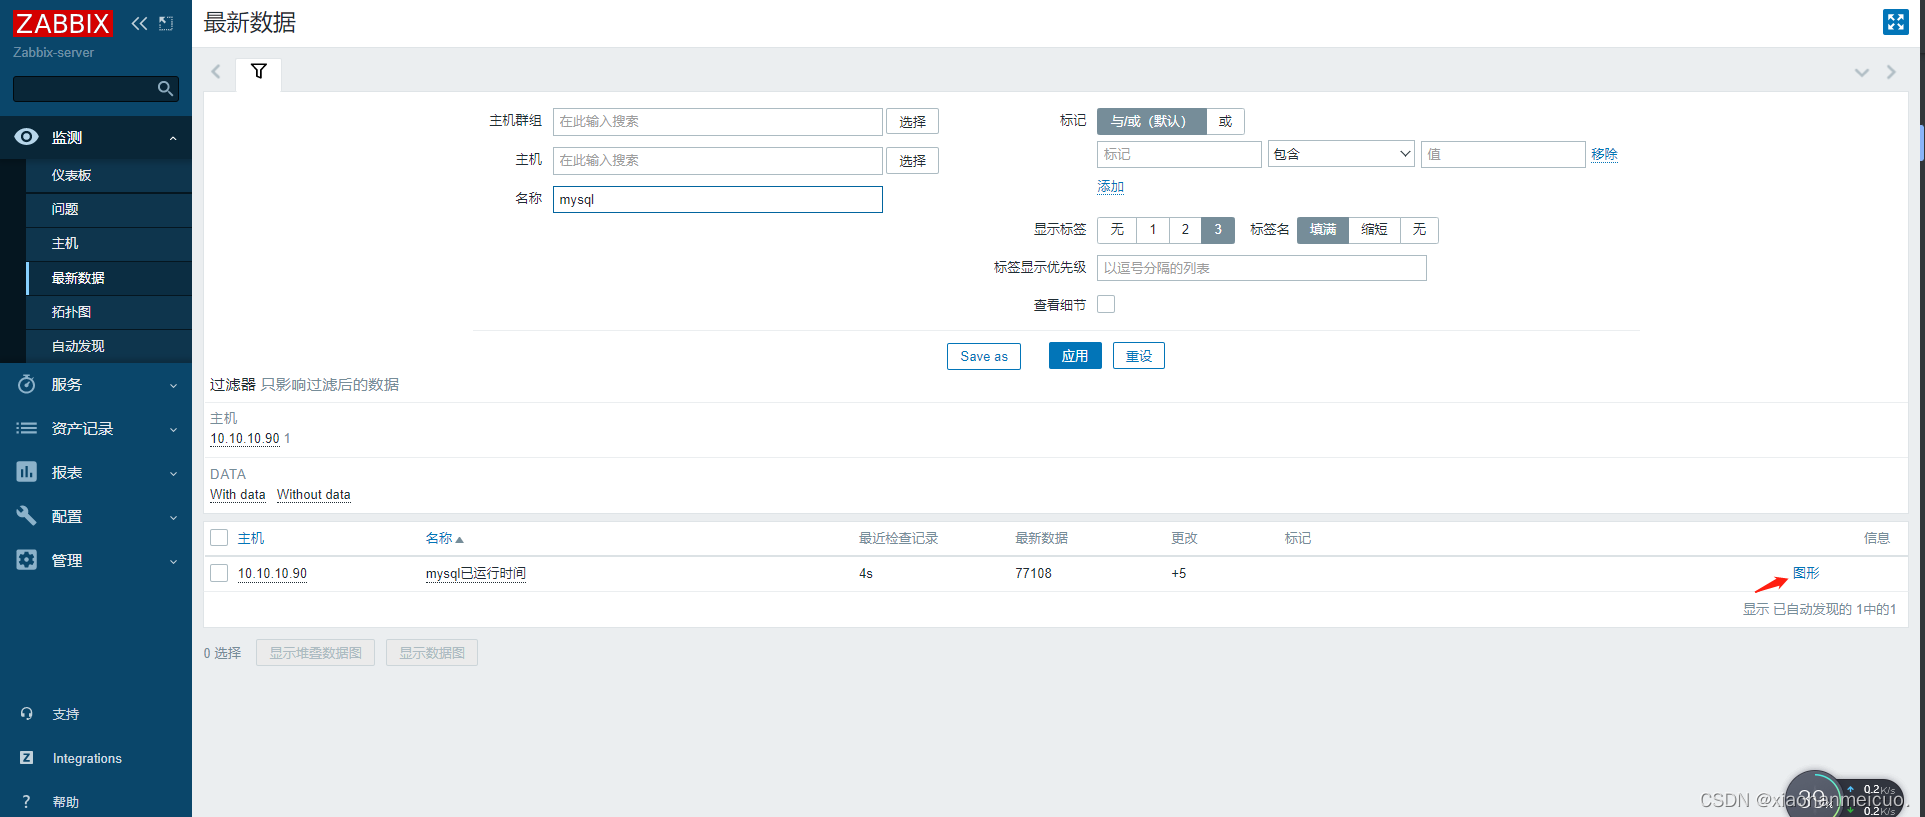
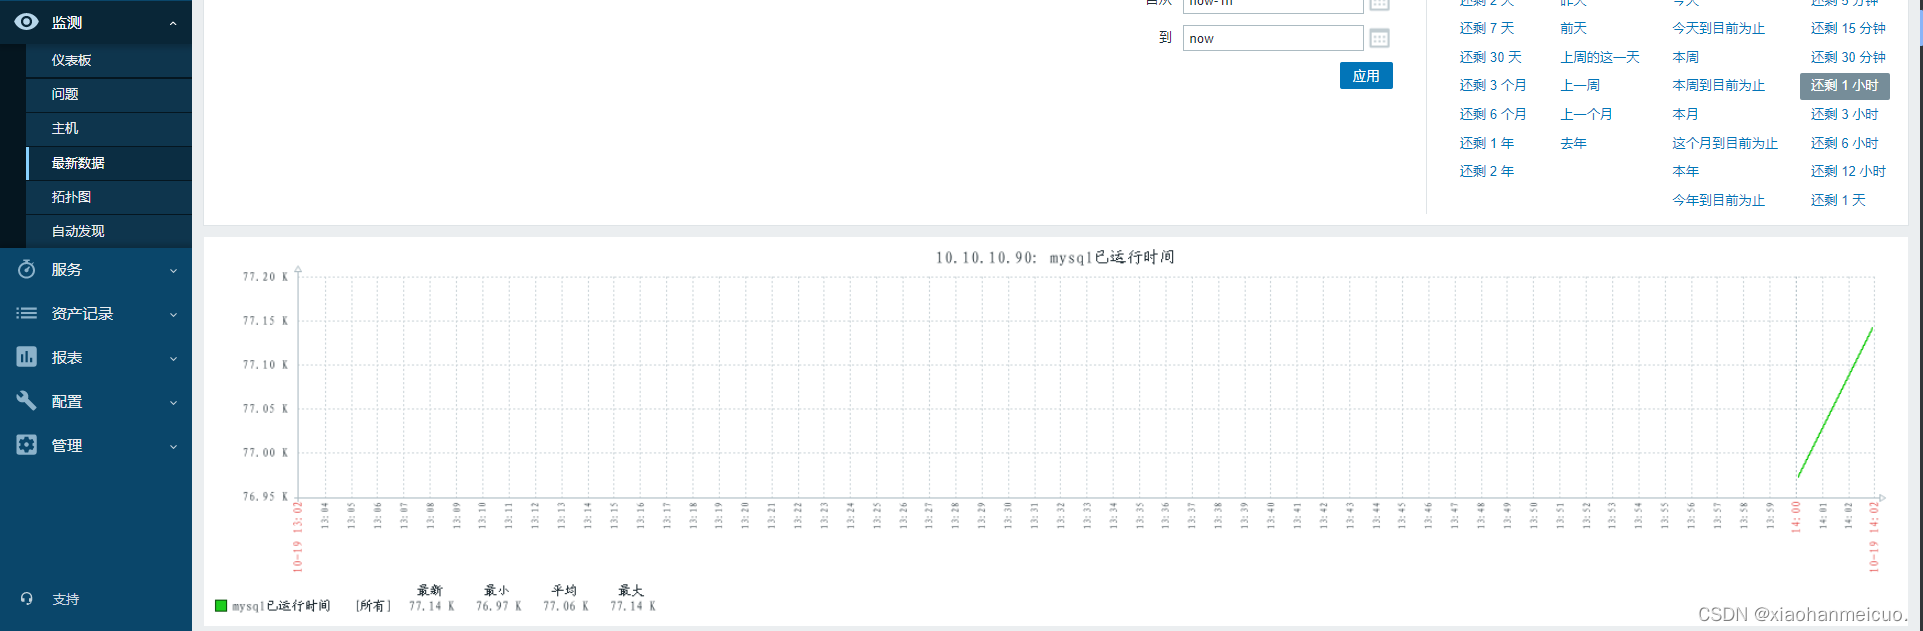
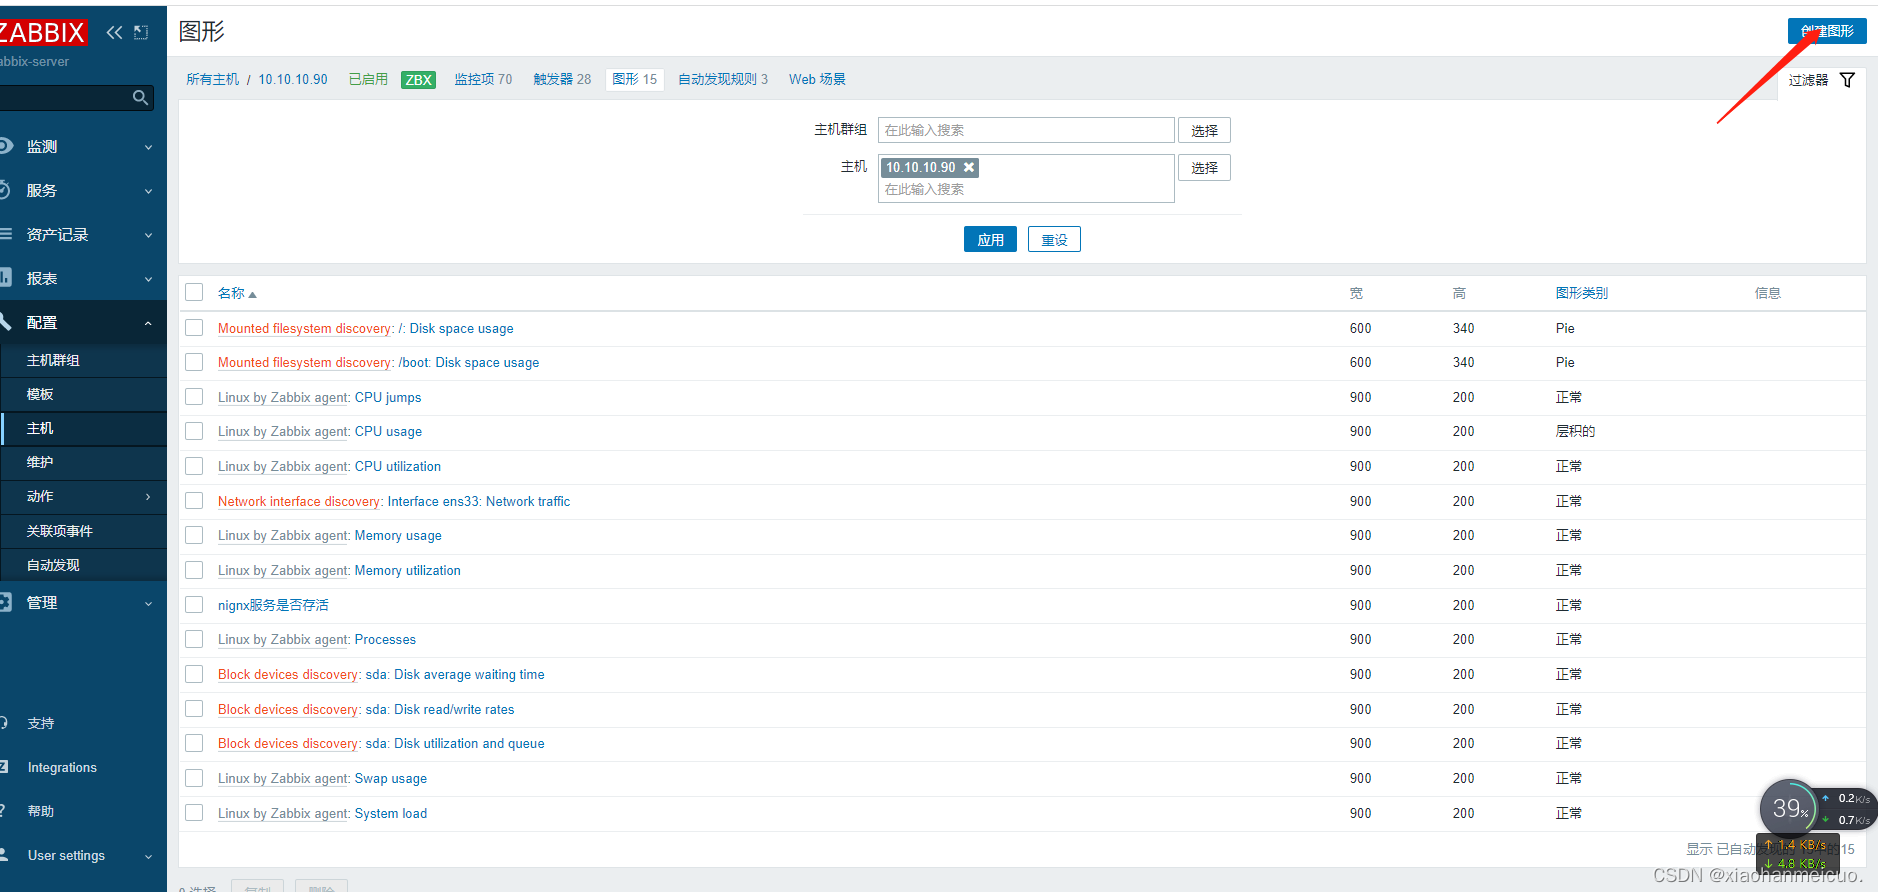
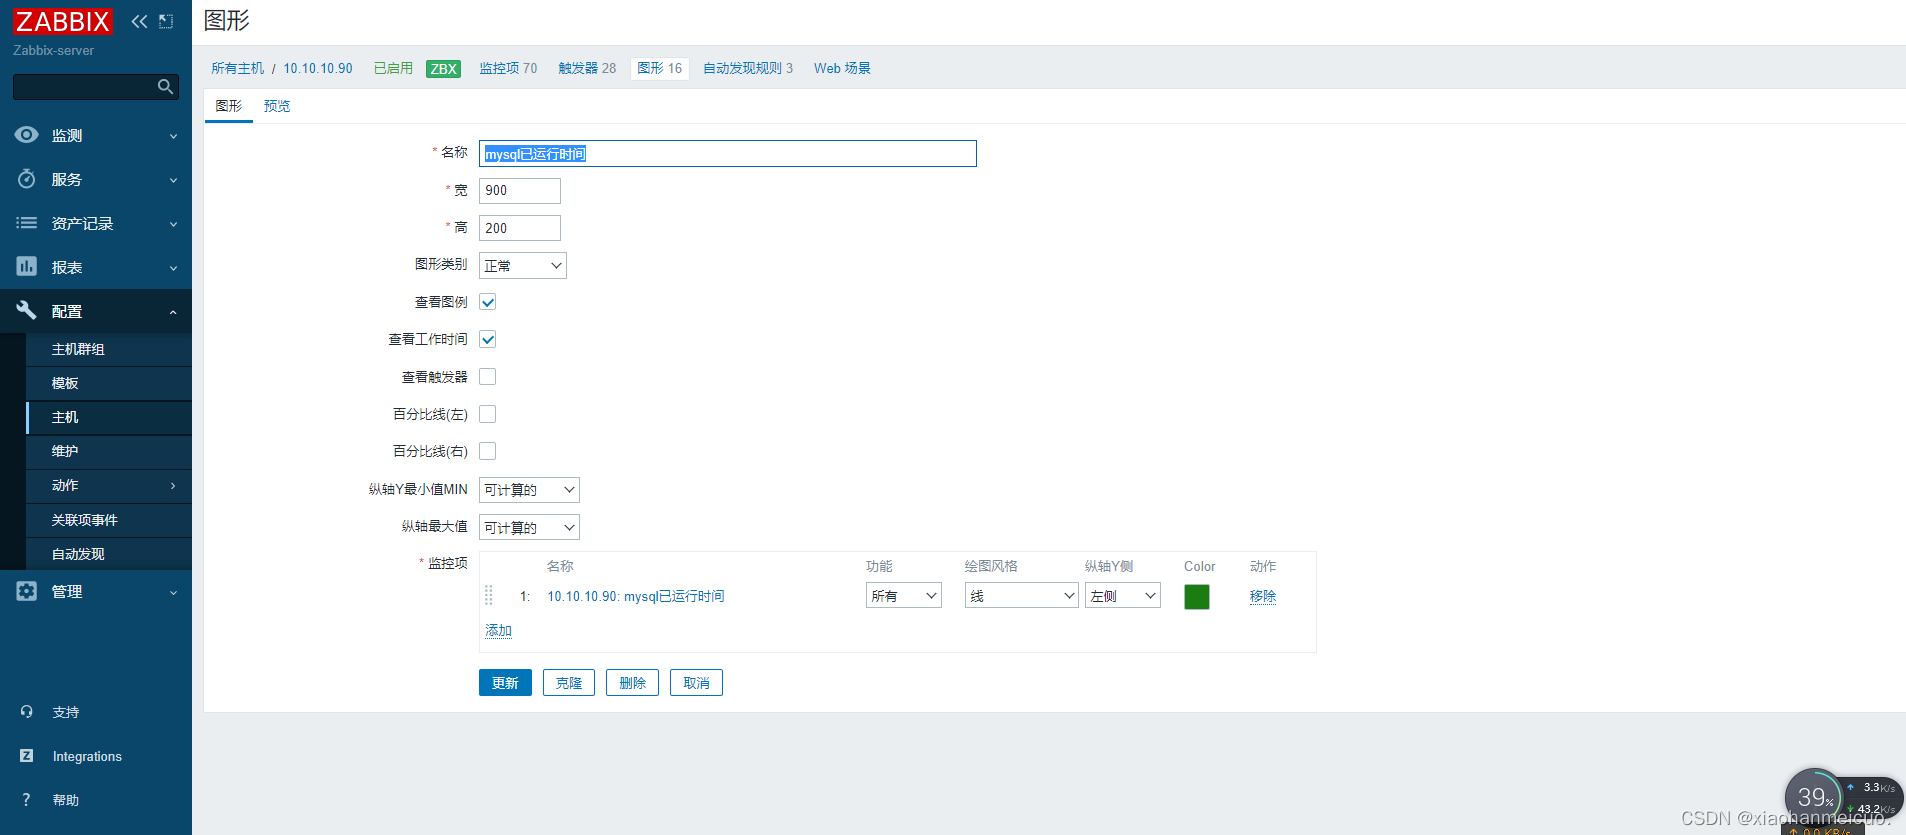
5.创建自定义图形


 2747
2747

 被折叠的 条评论
为什么被折叠?
被折叠的 条评论
为什么被折叠?
 到【灌水乐园】发言


