


 本文详细介绍了SpringBootActuator的使用,包括如何监控指标、ActuatorEndpoint的管理与定制,以及如何通过SpringBoot Admin Server进行可视化监控。讲解了Health和Metrics Endpoint的常见用法,以及如何自定义Health和Metrics信息,提供了定制Endpoint的方法和示例。
目录
11.1.4 可视化SpringBoot Admin Server
11.3.3.1 SpringBoot支持自动适配的Metrics
第十一章 指标监控
11.1 SpringBootActuator
11.1.1 简介
未来每一个微服务在云上部署以后,我们都需要对其进行监控、追踪、审计、控制等。SpringBoot就抽取了Actuator场景,使得我们每个微服务快速引用即可获得生产级别的应用监控、审计等功能。
<dependency>
<groupId>org.springframework.boot</groupId>
<artifactId>spring-boot-starter-actuator</artifactId>
</dependency>
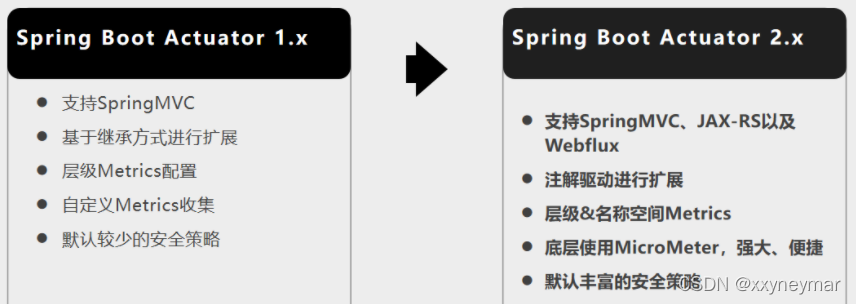
11.1.2 1.x与2.x的不同
11.1.3 如何使用
- 引入场景
- 访问http://localhost:8080/actuator/**
- 暴露所有监控信息为HTTP
# management 是所有actuator的配置
# management.endpoint.端点名.xxxx  对某个端点的具体配置
management:
  endpoints: #对所有端点
    enabled-by-default: true  #默认开启所有监控端点true
    web:
      exposure:
        include: '*' # 以web方式暴露所有端点
- 测试,如:
- http://localhost:8080/actuator/beans
- http://localhost:8080/actuator/configprops
- http://localhost:8080/actuator/metrics
- http://localhost:8080/actuator/metrics/jvm.gc.pause
- http://localhost:8080/actuator/endpointName/detailPath
11.1.4 可视化SpringBoot Admin Server
GitHub - codecentric/spring-boot-admin: Admin UI for administration of spring boot applications
11.2 Actuator Endpoint
11.2.1 最常使用的端点
| ID |
描述 |
|
|
暴露当前应用程序的审核事件信息,需要一个 |
|
|
显示应用程序中所有Spring Bean的完整列表。 |
|
|
暴露可用的缓存。 |
|
|
显示自动配置的所有条件信息,包括匹配或不匹配的原因。 |
|
|
显示所有 |
|
|
暴露Spring的属性 |
|
|
显示已应用的所有Flyway数据库迁移。 |
|
|
显示应用程序运行状况信息。 |
|
|
显示HTTP跟踪信息(默认情况下,最近100个HTTP请求-响应)。需要一个 |
|
|
显示应用程序信息。 |
|
|
显示Spring |
|
|
显示和修改应用程序中日志的配置。 |
|
|
显示已应用的所有Liquibase数据库迁移。需要一个或多个 |
|
|
显示当前应用程序的“指标”信息。 |
 最低0.47元/天 解锁文章


 722
722

 被折叠的 条评论
为什么被折叠?
被折叠的 条评论
为什么被折叠?
 到【灌水乐园】发言


