


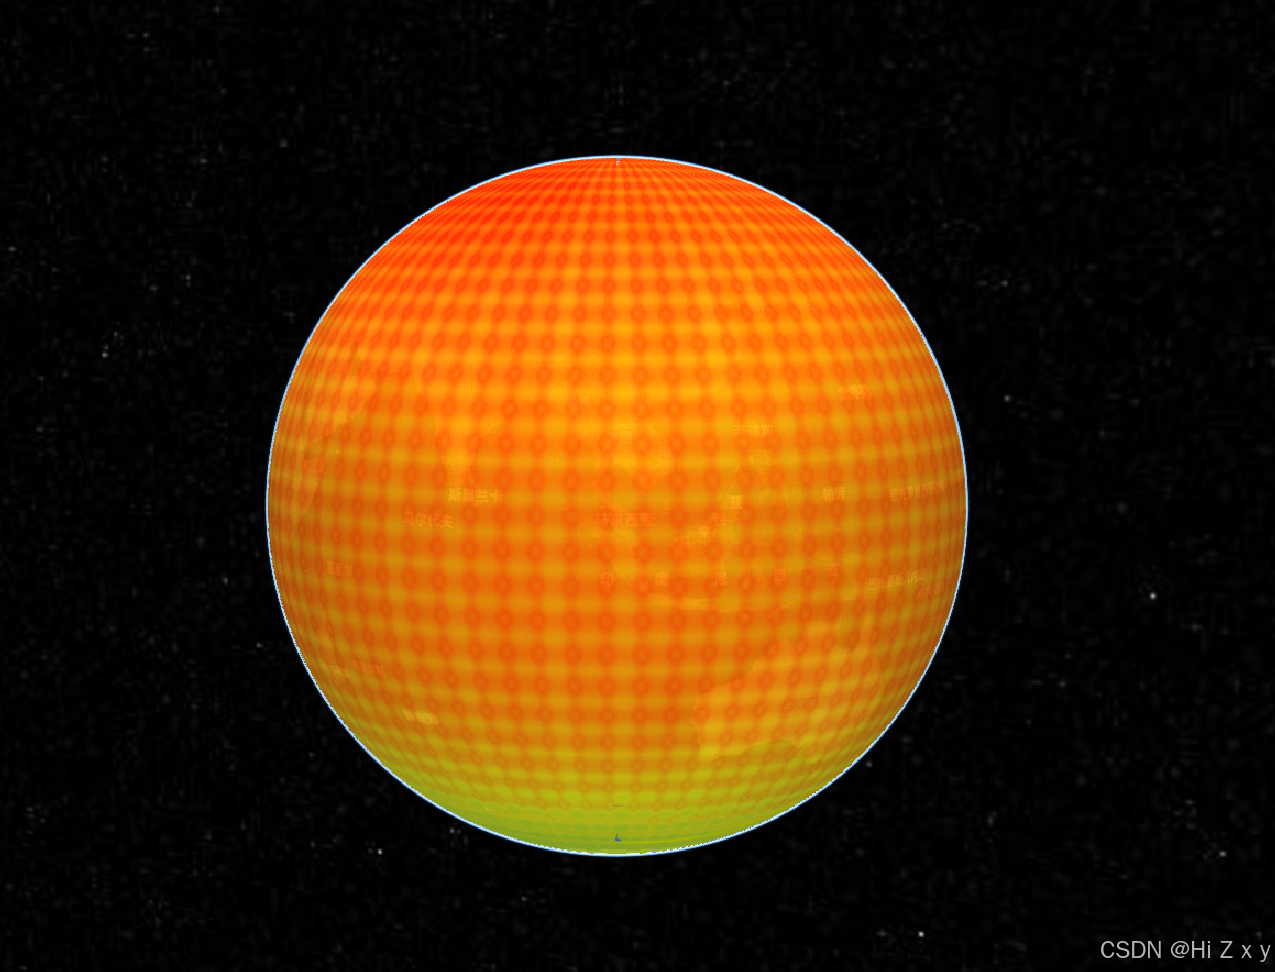
先上效果图
一、准备工作(默认已经实现了cesium地图)
1、安装heatmap.js
npm i heatmap.js
简单来说是将数据集进行处理 ,然后生成一个canvas 后盖在地球上
二、直接上代码
1、template代码
    <div id="cesium-container" ref="containerRef"></div>
    <div id="heatmap" v-show="false" :style="{ width: containerWidth + 'px', height: containerHeight + 'px' }"></div>
2、ts代码
首先要确保画布宽高与地球容器宽高相同,否则会出现数据不准确问题
代码如下:
  onMounted(() => {
    cesiumInit();
    const container = containerRef.value;

    if (container) {
      // 初始宽高
      containerWidth.value = container.offsetWidth;
      containerHeight.value = container.offsetHeight;
      console.log('containerWidth', containerWidth.value, containerHeight.value);
      // 创建 ResizeObserver 监听宽高变化
      const resizeObserver = new ResizeObserver((entries) => {
        for (let entry of entries) {
          containerWidth.value = entry.contentRect.width;
          containerHeight.value = entry.contentRect.height;
        }
      });

      resizeObserver.observe(container);
    }
    console.log(container.clientWidth,container.clientHeight,'yuan1');
    console.log(container.offsetWidth,container.offsetHeight,'yuan2');
  });
然后靠inithot方法实现,具体代码如下:
  function inithot(e) {
    console.log(e, 1111111111);

    // // 删除旧的热力图实体
    // const heatmapEntity = viewer.entities.getById('heatmap-layer');
    // if (heatmapEntity) {
    //   viewer.entities.remove(heatmapEntity);
    // }

    // 热力图数据
    const data = e.dtoList;
    // 遍历data 将data中的lon为-180 的复制一个添加到data中,将复制的这个的lon改为正180
    data.forEach(item => {
      if (item.lon === -180) {
        data.push({lat: item.lat, lon: 180, value: item.value})
      }
    })


    // 热力图的边界
    const latMin = -90,
      latMax = 90,
      lonMin = -180,
      lonMax = 180;
    // 热力图容器大小
    const width = containerWidth.value,
      height = containerHeight.value;
    console.log(width, height,'reli');

    // 将经纬度数据转换为热力图坐标
    let points = [];
    let max = parseFloat(e.maxValue) + 20;
    for (let i = 0; i < data.length; i++) {
      const dataItem = data[i];
      const point = {
        x: Math.floor(((dataItem.lon - lonMin) / (lonMax - lonMin)) * width),
        y: Math.floor(((latMax - dataItem.lat) / (latMax - latMin)) * height),
        value: dataItem.value,
      };
      max = Math.max(max, dataItem.value);
      points.push(point);
    }

    // 删除旧的热力图实例(如果有的话)
    const heatmapContainer = document.querySelector('#heatmap');
    if (heatmapContainer) {
      heatmapContainer.innerHTML = ''; // 清空热力图容器内容
    }

    // 创建 h337 热力图实例,在index中引入的
    const heatmapInstance = h337.create({
      container: document.querySelector('#heatmap'), // 热力图 div 容器
      // radius: 25,
      // maxOpacity: 0.6, // 设置热力图的最大不透明度
      // minOpacity: 0.1, // 设置热力图的最小不透明度
      // blur: 1, // 模糊程度,值越大,模糊越强
    });

    // 设置热力图数据
    heatmapInstance.setData({
      max: max,
      data: points,
    });

    viewer._cesiumWidget._creditContainer.style.display = 'none'; // 隐藏 Cesium 标志

    // 获取生成的热力图 canvas
    let canvas = document.querySelector('.heatmap-canvas');
    console.log(canvas, 2222222222);

    // 将热力图叠加到 Cesium 地图上
   viewer.entities.add({
      id: 'heatmap-layer', // 给热力图实体指定唯一 id
      // name: 'heatmap-layer',
      rectangle: {
        coordinates: Cesium.Rectangle.fromDegrees(lonMin, latMin, lonMax, latMax),
        material: new Cesium.ImageMaterialProperty({
          image: canvas,
          transparent: true,
        }),
      },
    });

    // 将地图聚焦到热力图区域
    // viewer.zoomTo(viewer.entities);
  }
至此,给地球加全球热力图就完成了!(有问题可以私聊我哦)


 364
364

 被折叠的 条评论
为什么被折叠?
被折叠的 条评论
为什么被折叠?
 到【灌水乐园】发言


