


 本文介绍如何使用Golang内置的pprof工具进行内存泄漏检测,包括安装必要工具、配置代码以生成内存快照,以及如何解析和理解生成的报告。
golang内存泄露工具检查
-
安装工具
-
brew install graphviz (生成图片时候要用到dot)
- 使用pprof工具实现
- 简单使用场景
package main

import (
	"fmt"
	"net/http"
	"runtime/pprof"
	"time"
)

var quit chan struct{} = make(chan struct{})

func ffff() {
	<-quit
}

func handler(w http.ResponseWriter, r *http.Request) {
	w.Header().Set("Content-Type", "text/plain")

	p := pprof.Lookup("goroutine")
	//p.WriteTo(w, 0)
	p.WriteTo(w, 1)
	//p.WriteTo(w, 2)

}

func main() {
	timer := time.NewTimer(3 * time.Second)

	go func() {
		<-timer.C
		fmt.Println("Timer has expired.")
	}()

	timer.Stop()

	for i := 0; i < 100; i++ {
		go ffff()
	}

	http.HandleFunc("/", handler)
	http.ListenAndServe(":11181", nil)
}
- 直接访问http://localhost:11181/即可查看信息
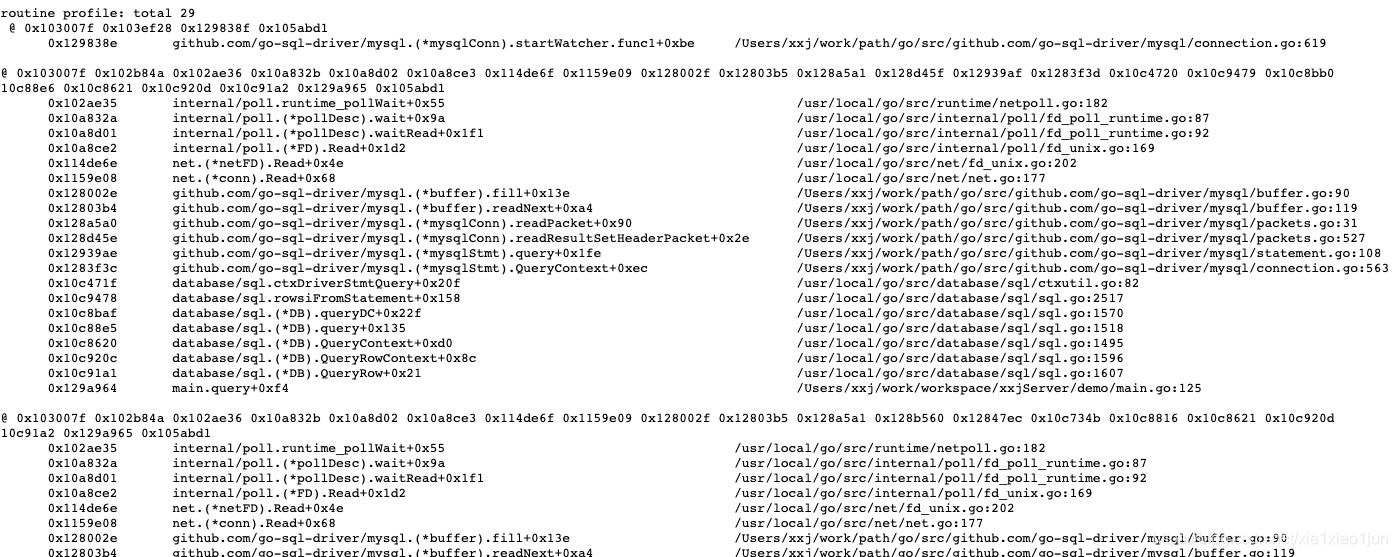
具体详细分析数据
- demo 依然是上边的程序 改造一下
package main

import (
	"fmt"
	"net/http"
	"os"
	"runtime"
	"runtime/pprof"
	"strings"
	"time"
)

var (
	pid      int
	progname string
)

var quit chan struct{} = make(chan struct{})

func init() {
	pid = os.Getpid()
	paths := strings.Split(os.Args[0], "/")
	paths = strings.Split(paths[len(paths)-1], string(os.PathSeparator))
	progname = paths[len(paths)-1]
	runtime.MemProfileRate = 1
}

func ffff() {
	<-quit
}

func handler(w http.ResponseWriter, r *http.Request) {
	w.Header().Set("Content-Type", "text/plain")

	p := pprof.Lookup("goroutine")
	//p.WriteTo(w, 0)
	p.WriteTo(w, 1)
	//p.WriteTo(w, 2)

}

func saveHeapProfile() {
	runtime.GC()
	f, err := os.Create(fmt.Sprintf("./heap_%s_%d_%s.prof", progname, pid, time.Now().Format("2006_01_02_03_04_05")))
	if err != nil {
		return
	}
	defer f.Close()
	pprof.Lookup("heap").WriteTo(f, 1)
}

func main() {
	timer := time.NewTimer(3 * time.Second)

	go func() {
		<-timer.C
		fmt.Println("Timer has expired.")
	}()

	timer.Stop()

	for i := 0; i < 100; i++ {
		go ffff()
	}

	go func() {

		time.Sleep(3 * time.Second)
		saveHeapProfile()
	}()

	http.HandleFunc("/", handler)
	http.ListenAndServe(":11181", nil)
}
记得:
go build
go run
- 3秒后当前目录生成一个文件:
heap_main_13712_2019_06_07_02_50_56.prof
命令工具
go tool pprof ./main ./heap_main_13712_2019_06_07_02_50_56.prof
进入pprof 内部 可以使用 top 10等命令来查看过滤信息,exit退出
$ go tool pprof ./main ./heap_main_13712_2019_06_07_02_50_56.prof
File: main
Type: inuse_space
Entering interactive mode (type "help" for commands, "o" for options)
(pprof)
go tool pprof --text ./main ./heap_main_13712_2019_06_07_02_50_56.prof
查看各个函数/方法的内存消耗排名
$ go tool pprof --text ./main ./heap_main_13712_2019_06_07_02_50_56.prof
File: main
Type: inuse_space
Showing nodes accounting for 54.55kB, 98.55% of 55.35kB total
Dropped 18 nodes (cum <= 0.28kB)
      flat  flat%   sum%        cum   cum%
   40.88kB 73.85% 73.85%    40.88kB 73.85%  runtime.malg
    9.28kB 16.77% 90.61%     9.28kB 16.77%  main.ffff
       1kB  1.81% 92.42%        1kB  1.81%  runtime.allgadd
       1kB  1.81% 94.23%        2kB  3.61%  runtime.allocm
    0.73kB  1.33% 95.55%     0.74kB  1.34%  net/http.http2ConfigureServer
    0.62kB  1.13% 96.68%    43.75kB 79.04%  runtime.systemstack
    0.45kB  0.82% 97.50%     0.48kB  0.88%  net/http.(*ServeMux).Handle
    0.25kB  0.45% 97.95%     0.62kB  1.13%  runtime.mcommoninit
    0.20kB  0.37% 98.32%     2.10kB  3.80%  main.main
    0.06kB  0.11% 98.43%     1.04kB  1.88%  net/http.(*Server).Serve
    0.06kB  0.11% 98.55%     0.80kB  1.45%  net/http.(*Server).onceSetNextProtoDefaults
         0     0% 98.55%     1.28kB  2.31%  net/http.(*Server).ListenAndServe
         0     0% 98.55%     0.80kB  1.45%  net/http.(*Server).onceSetNextProtoDefaults_Serve
         0     0% 98.55%     0.80kB  1.45%  net/http.(*Server).setupHTTP2_Serve
         0     0% 98.55%        2kB  3.61%  runtime.entersyscallblock_handoff
         0     0% 98.55%    11.60kB 20.96%  runtime.goexit
         0     0% 98.55%        2kB  3.61%  runtime.handoffp
         0     0% 98.55%     2.10kB  3.80%  runtime.main
         0     0% 98.55%        2kB  3.61%  runtime.newm
         0     0% 98.55%    41.12kB 74.30%  runtime.newproc.func1
         0     0% 98.55%    41.12kB 74.30%  runtime.newproc1
         0     0% 98.55%    43.75kB 79.04%  runtime.startTheWorldWithSema
         0     0% 98.55%        2kB  3.61%  runtime.startm
         0     0% 98.55%     0.80kB  1.45%  sync.(*Once).Do
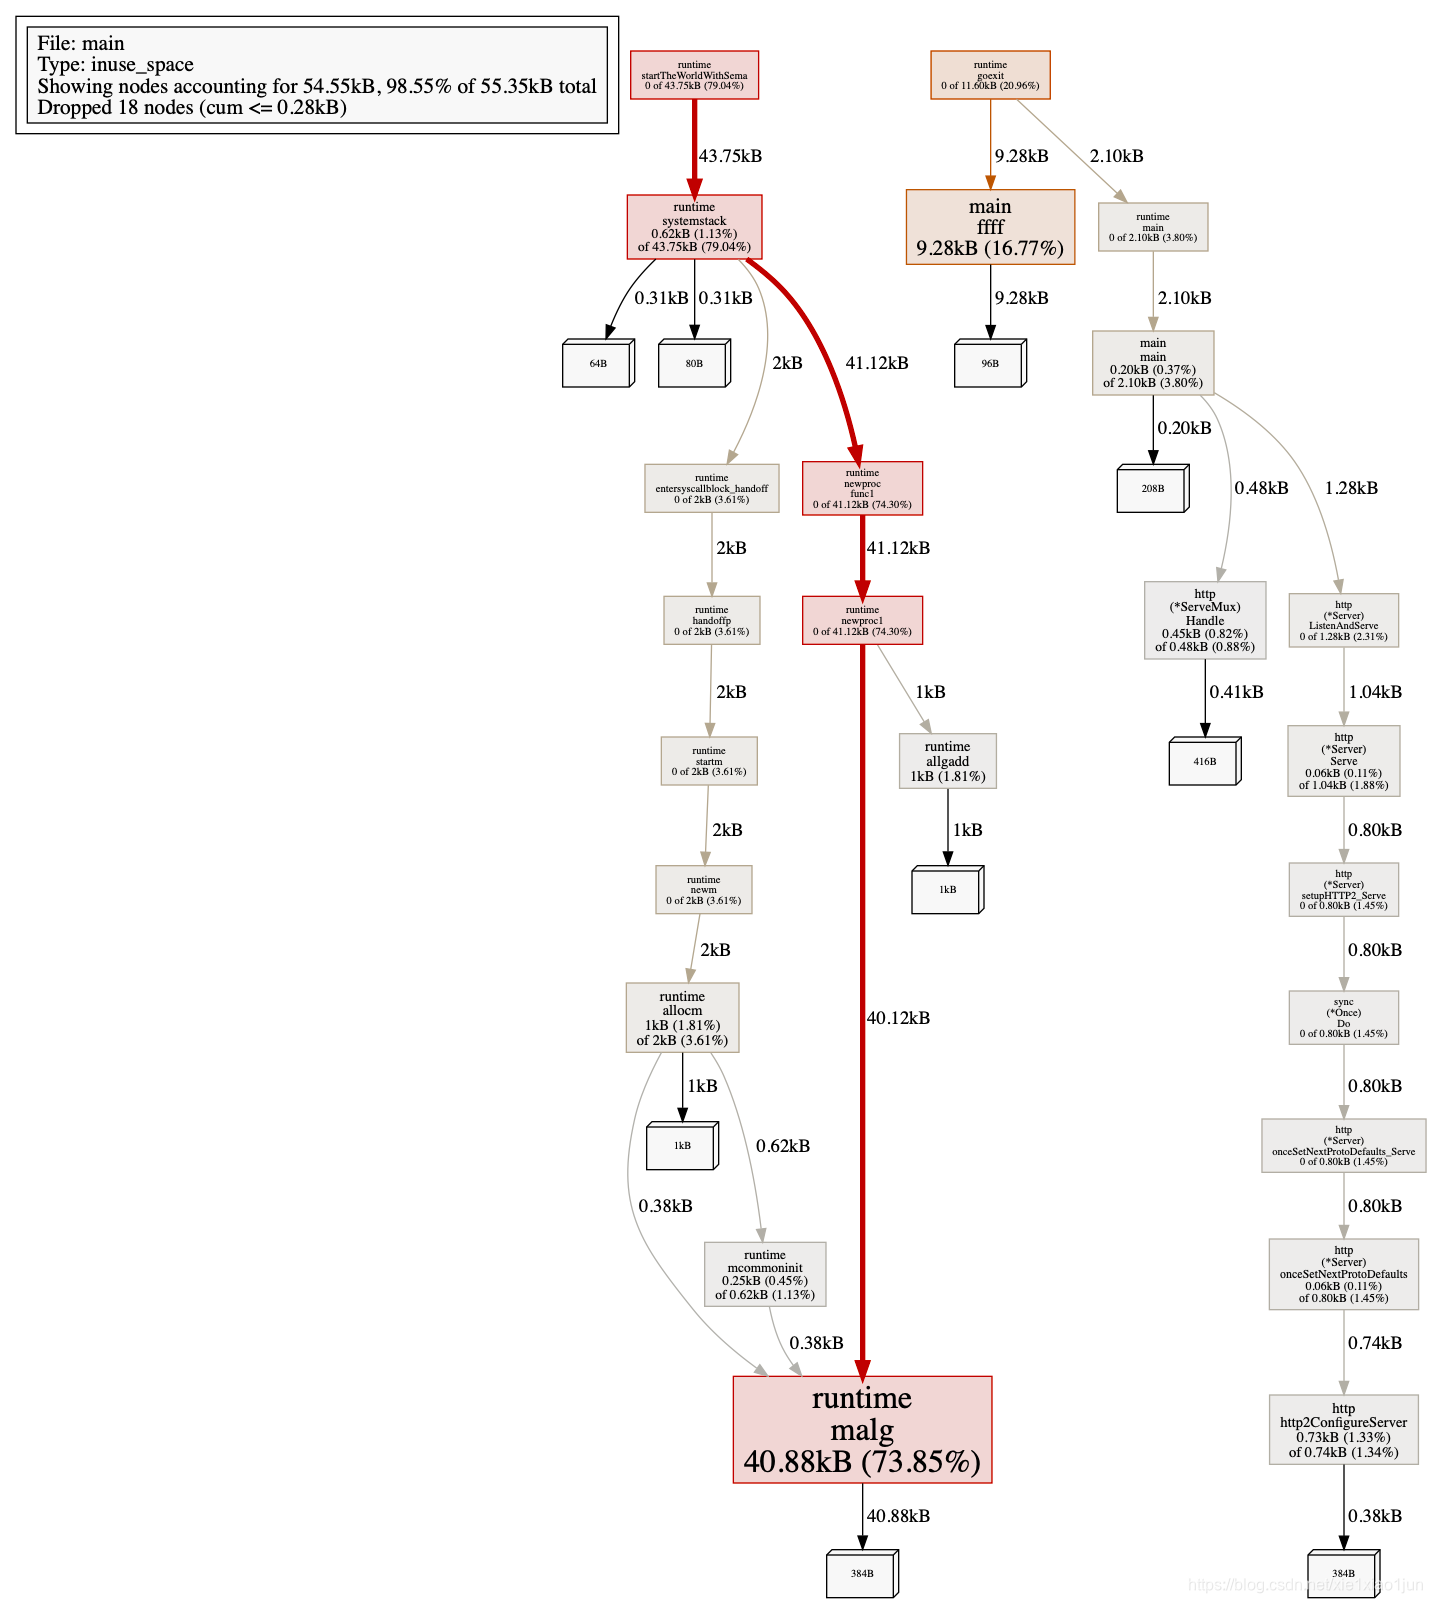
go tool pprof --dot ./main ./heap_main_13712_2019_06_07_02_50_56.prof > heap.gv
生成可以在graphviz里面看的gv文件
- 通过3的gv文件直接生成图片
dot -T png heap.gv>heap.png
- 打开图片查看信息


 1077
1077

 被折叠的 条评论
为什么被折叠?
被折叠的 条评论
为什么被折叠?
 到【灌水乐园】发言


