


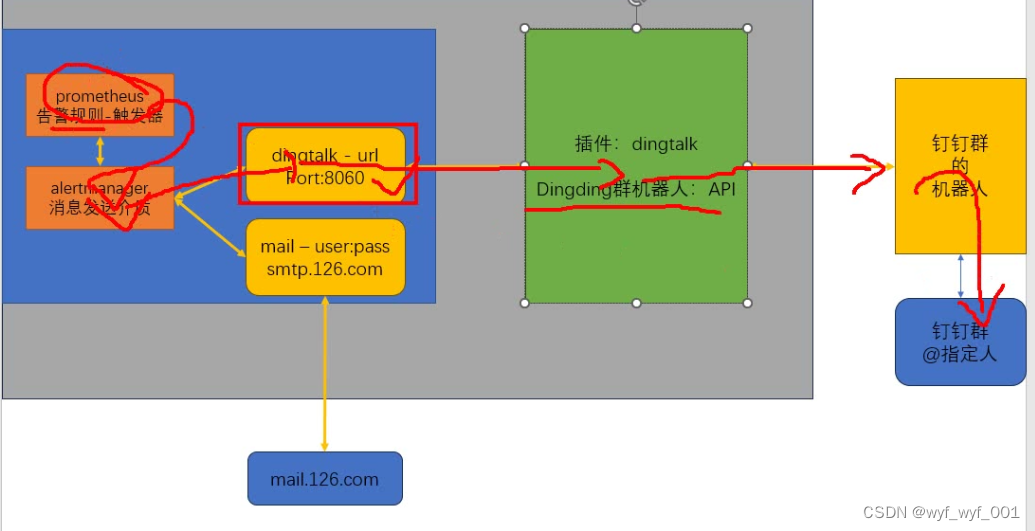
报警过程
一、实验准备
1、准备两台虚拟机
2、虚拟机连通互联网
二、实验步骤
1、Prometheus-server端
1.1下载并安装Prometheus Server服务
$ rz promethues.zip
$ unzip promethues.zip
# 单独解压缩Prometheus软件,完成安装
$ tar -xf prometheus-2.14.0.linux-amd64.tar.gz
$ cd prometheus-2.14.0.linux-amd64/
$ tree ./
# Prometheus安装非常简单,解压缩复制到自定义目录下即可,约定成俗的习惯:/usr/local/prometheus
$ cp -r prometheus-2.14.0.linux-amd64/ /usr/local/prometheus
1.2 编写Prometheus service启动脚本
$ cat>/usr/local/prometheus/prometheus.service<<EOF
[Unit]
Description=Prometheus
After=network.target
[Service]
Type=simple
User=root
WorkingDirectory=/usr/local/prometheus
ExecStart=/usr/local/prometheus/prometheus --config.file=/usr/local/prometheus/prometheus.yml
Restart=on-failure
LimitNOFILE=65536
[Install]
WantedBy=multi-user.target
EOF
1.3 添加启动脚本到systemd启动管理中
$ ln -s /usr/local/prometheus/prometheus.service /lib/systemd/system/
$ systemctl daemon-reload
$ systemctl start prometheus
$ systemctl enable prometheus
$ netstat -antp | grep LISTEN | grep :9090
tcp6 0 0 :::9090 :::* LISTEN 37984/prometheus
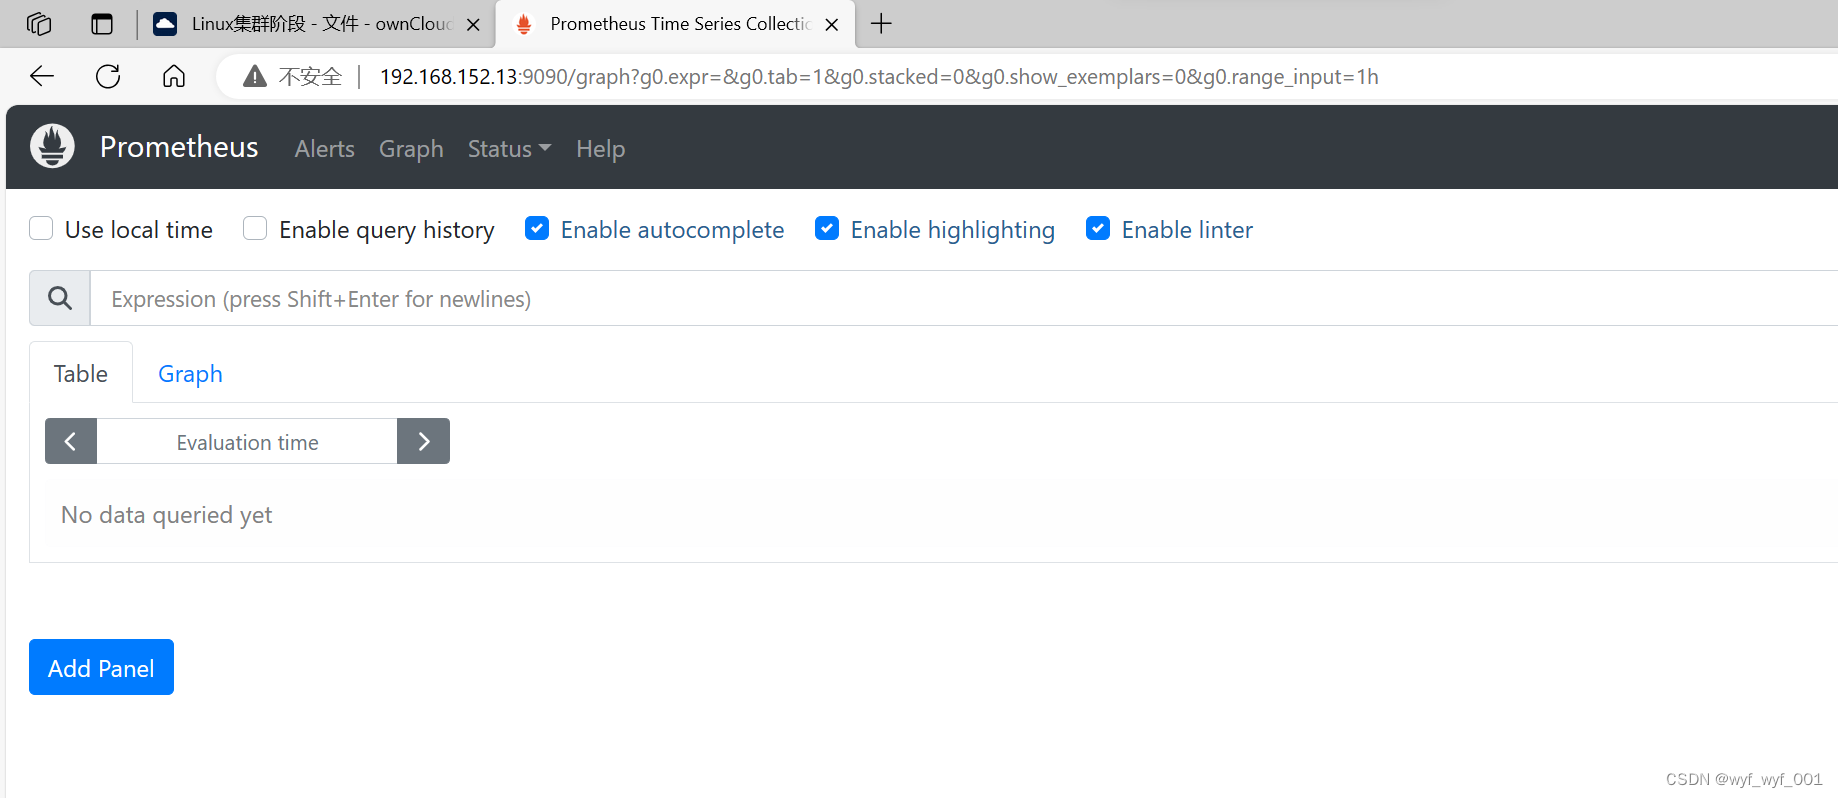
1.4 使用Windows浏览器访问192.168.152.13:9090,进行测试。
1.5 配置文件讲解
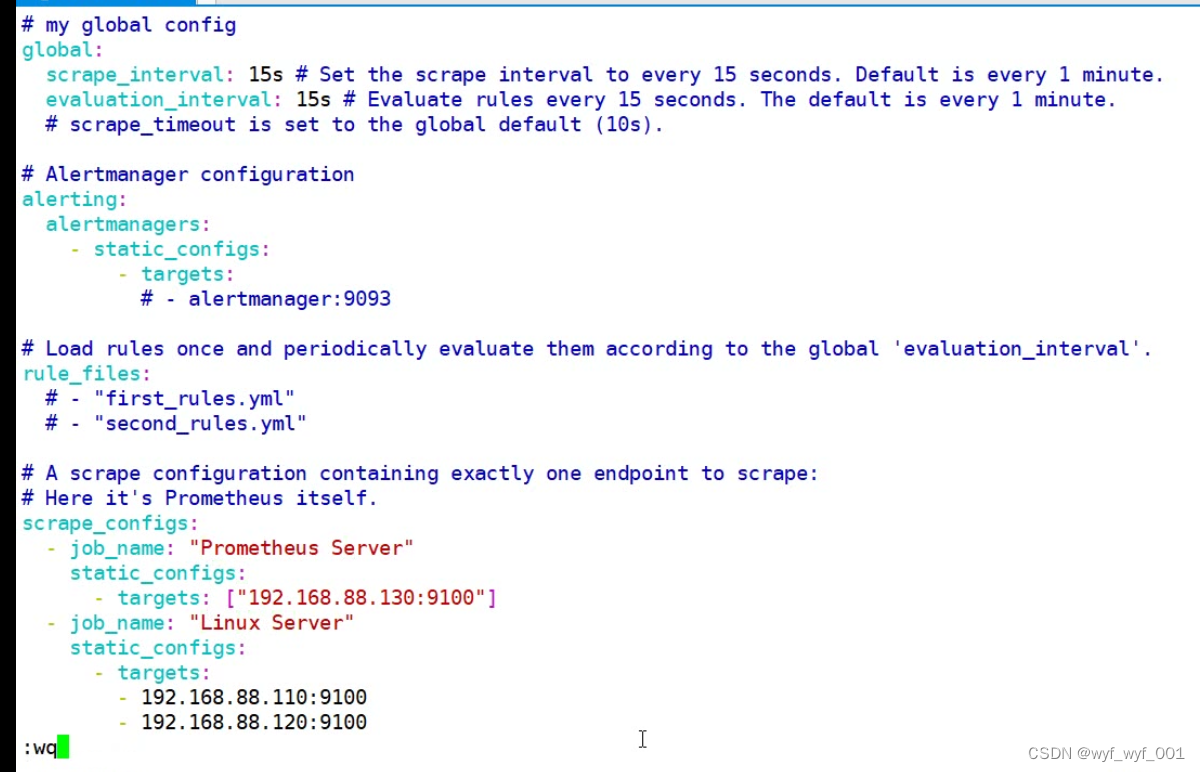
# 配置文件(原版未改)
$ vim /usr/local/prometheus/prometheus.yml
# my global config
global:
scrape_interval: 15s # Set the scrape interval to every 15 seconds. Default is every 1 minute.
evaluation_interval: 15s # Evaluate rules every 15 seconds. The default is every 1 minute.
# scrape_timeout is set to the global default (10s).
# Alertmanager configuration
alerting:
alertmanagers:
- static_configs:
- targets:
# - alertmanager:9093
# Load rules once and periodically evaluate them according to the global 'evaluation_interval'.
rule_files:
# - "first_rules.yml"
# - "second_rules.yml"
# A scrape configuration containing exactly one endpoint to scrape:
# Here it's Prometheus itself.
scrape_configs:
# The job name is added as a label `job=<job_name>` to any timeseries scraped from this config.
- job_name: 'prometheus'
# metrics_path defaults to '/metrics'
# scheme defaults to 'http'.
static_configs:
- targets: ['localhost:9090']
# -----------------------------------------------------------------------------------------------
# 配置文件关键词介绍(由于alertmanager、exporter等都未安装,相关配置后面详细讲)
global: # 全局配置 (如果有内部单独设定,会覆盖这个参数)
scrape_interval: 15s
# 全局默认的数据拉取间隔
evaluation_interval: 15s
# 全局默认的规则(主要是报警规则)拉取间隔
scrape_timeout: 10s
# 全局默认的单次数据拉取超时间,默认不开启,当报context deadline exceeded错误时需要在特定的job下配置该字段,注意:scrape_timeout时间不能大于scrape_interval,否则Prometheus将会报错。
alerting: # 告警插件定义,这里会设定alertmanager这个报警插件。
rule_files: # 告警规则,按照设定参数进行扫描加载,用于自定义报警规则(类似触发器trigger),其报警媒介由alertmanager插件实现。
scrape_configs: # 采集配置,配置数据源,包含分组job_name以及具体target,又分为静态配置和服务发现。
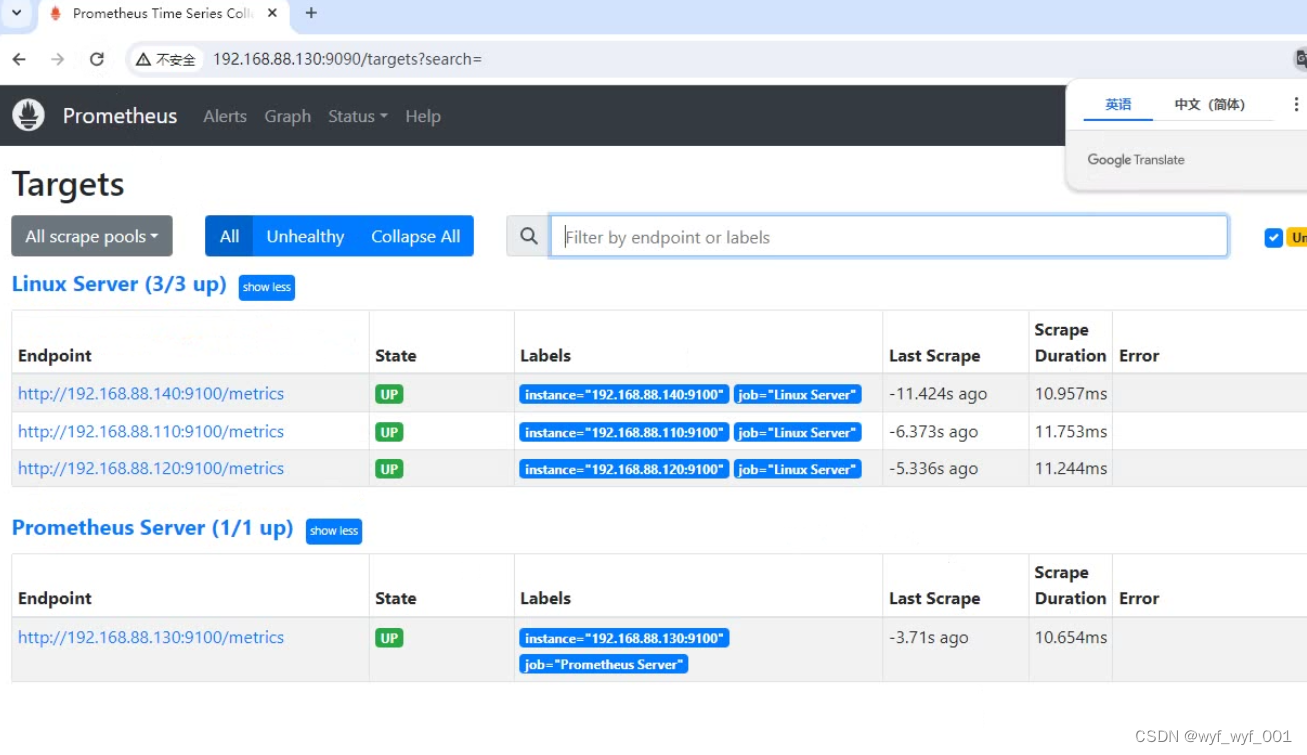
1.6 浏览器查看会有两个主机名群组,点击status ---target
2、Prometheus - Node Exporter部署
2.1 解压缩并安装Node Exporter
$ tar -xf node_exporter-0.18.1.linux-amd64.tar.gz
$ cp -r node_exporter-0.18.1.linux-amd64 /usr/local/node_exporter
2.2 编写Node Exporter启动脚本
$ cat>/usr/local/node_exporter/node_exporter.service<<EOF
[Unit]
 最低0.47元/天 解锁文章


 7万+
7万+

 被折叠的 条评论
为什么被折叠?
被折叠的 条评论
为什么被折叠?
 到【灌水乐园】发言


