


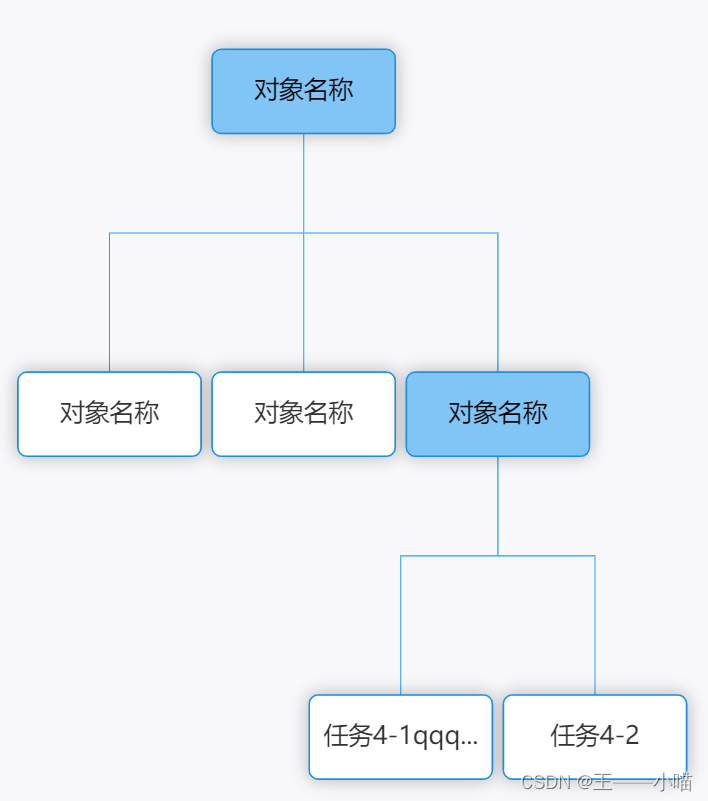
1.如何用echarts制作组织结构图
const getEchart = () => {
  type EChartsOption = echarts.EChartsOption;
  var dom = document.getElementById("right")!;
  var myChart = echarts.init(dom);
  let app = {};
  var option: EChartsOption;
   const data = {
    name: "对象名称",
    children: [
      {
        name: "对象名称",
        children: [
          {
            name: "任务名称1",
            value: 500,
            itemStyle: { color: "#ff9800" },
          },
          {
            name: "任务名称2",
            itemStyle: { color: "#4d8dd9" },
          },
          {
            name: "任务名称3",
            itemStyle: { color: "#22b07b" },
          },
        ],
      },
      {
        name: "对象名称",
        children: [
          {
            name: "任务3-1",
          },
          {
            name: "任务3-2",
          },
        ],
      },
      {
        name: "对象名称",
        children: [
          {
            name: "任务4-1qqqqqqqqqqqqqqqqqqqqqqqqqqqqqqqqqqqqqqqqqqqqq",
          },
          {
            name: "任务4-2",
          },
        ],
      },
    ],
  };
  option = {
    tooltip: {
      trigger: "item",
      triggerOn: "mousemove",
    },
    title: {
      text: "结构关系图",
    },
    toolbox: {
      feature: {
        saveAsImage: {
          show: true,
          title: "点击下载图片",
        },
      },
    },
    series: [
      {
        type: "tree",
        id: 0,
        // name: "tree1",
        data: [data],
        top: "10%",
        left: "10%",
        bottom: "20%",
        right: "10%",
        // avoidLabelOverlap: true, //防止标签重叠
        roam: true, //移动+缩放  'scale' 或 'zoom':只能够缩放。 'move' 或 'pan':只能够平移。
        scaleLimit: {
          //缩放比例
          min: 0.7, //最小的缩放值
          max: 4, //最大的缩放值
        },
        layout: "orthogonal", //树图布局,orthogonal水平垂直方向,radial径向布局 是指以根节点为圆心,每一层节点为环,一层层向外
        orient: "TB", //树形方向  TB为上下结构  LR为左右结构
        symbol: "circle", //标记的图形形状  rect方形  roundRect圆角 emptyCircle圆形 circle实心圆
        symbolSize: 14, //状态大小
        edgeShape: "polyline", //线条类型  curve曲线
        initialTreeDepth: 1, //初始展开的层级
        expandAndCollapse: true, //子树折叠和展开的交互,默认打开
        lineStyle: {
          //结构线条样式
          width: 0.7,
          color: "#1E9FFF",
        },
        label: {
          //节点文本样式
          backgroundColor: "#81c5f7",
          position: "bottom",
          verticalAlign: "middle", //文字垂直对齐方式
          align: "center",
          borderColor: "#1E9FFF",
          color: "#fff",
          borderWidth: 1,
          borderRadius: 5,
          padding: 5,
          height: 40,
          width: 100,
          offset: [0, 30], //节点文字与圆圈之间的距离
          fontSize: 15,
          // 节点文本阴影
          shadowBlur: 10,
          shadowColor: "rgba(0,0,0,0.25)",
          shadowOffsetX: 0,
          shadowOffsetY: 2,
        },
        leaves: {
          //叶子节点文本样式
          label: {
            // backgroundColor: '#81c5f7',
            backgroundColor: "#fff",
            color: "#333",
            position: "bottom",
            rotate: 0, //标签旋转。
            verticalAlign: "middle",
            align: "center",
            //文本框内文字超过6个字折行
            // formatter: function (val) {
            //   let strs = val.name.split(""); //字符串数组
            //   let str = "";
            //   for (let i = 0, s; (s = strs[i++]); ) {
            //     //遍历字符串数组
            //     str += s;
            //     if (!(i % 6)) str += "\n"; //按需要求余,目前是一个字换一行
            //   }
            //   return str;
            // },
            //或者
            overflow: "truncate", //break为文字折行,  truncate为文字超出部分省略号显示
            // lineOverflow: "truncate", //文字超出高度后 直接截取
          },
        },
        // expandAndCollapse: true, //默认展开树形结构
        animationDuration: 550,
        animationDurationUpdate: 750,
      },
    ],
  };
  window.onresize = function () {
    myChart.resize();
  };
  if (option && typeof option === "object") {
    myChart.setOption(option, true);
    //节点切换显示
    // myChart.on("mousedown", (e) => {
    //   const name = e.data.name;
    //   const curNode = myChart._chartsViews[0]._data.tree._nodes.find((item) => {
    //     return item.name === name;
    //   });
    //   const depth = curNode.depth;
    //   const curIsExpand = curNode.isExpand;
    //   myChart._chartsViews[0]._data.tree._nodes.forEach((item, index) => {
    //     if (item.depth === depth && item.name !== name && !curIsExpand) {
    //       item.isExpand = false;
    //     }
    //   });
    // });
  }
};
2.如何结合formatter和rich制作好看的样式(我的实现过程个人感觉挺复杂,如果你有更好的实现方法,欢迎分享)
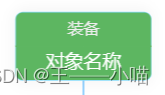
 formatter: function (params) {
            let res;
            switch (params.name) {
              case "装备":
                res = [
                  "{structure1|}{title|装备}{abg1|}",
                  "{hr1|}",
                  "{title2|对象名称}{abg11|}",
                ].join("\n");
                return res;
              default:
                return "";
            }
          },
          rich: {
            title: {
              color: "#eee",
              align: "center",
            },
            title2: {
              color: "#fff",
              align: "center",
              fontSize: 14,
            },
            abg1: {
              backgroundColor: "#5db661",
              width: "100%",
              align: "right",
              height: 25,
              borderWidth: 0,
              borderRadius: [5, 5, 0, 0],
            },
            structure1: {
              position: "absolute",
              height: 18,
              align: "right",
              backgroundColor: {
                image: Icons.structure1,
              },
            },
            abg11: {
              backgroundColor: "#5db661",
              width: "100%",
              align: "right",
              height: 25,
              borderRadius: [0, 0, 5, 5],
            },
            hr1: {
              borderColor: "#5db661",
              width: "100%",
              align: "right",
              borderWidth: 1,
              height: 0,
            },
3.在用 echarts 实现 组织结构的过程中,遇到的报错:
报错一:
在渲染echarts图的时候,可能会出现dom元素没有渲染的错误(Initialize failed: invalid dom.),所以需要使用setTimeout异步执行,而不能立即执行。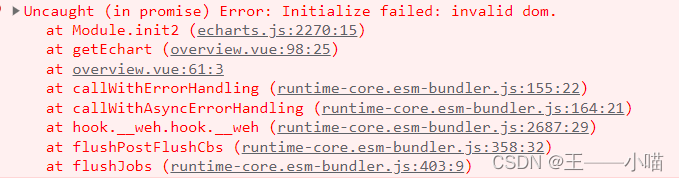
onMounted(() => {
  setTimeout(() => {
    getEchart();
  }, 0);
});
报错二:
当直接使用image: ('@/icons/svg/structure1.svg'),或者image: ('../../icons/svg/structure1.svg')这种相对路径引入图片时可能会报错,所以使用变量名接收图片,这样就不会报错。
![]()
import structure1 from "@/icons/svg/structure1.svg";
const Icons = {
  structure1: structure1,
};
报错三:
在本地开发时,多次点击都能正常显示,但是部署到线上环境后,只有第一次点击才显示,之后不再显示。
需要在渲染echarts图前,加一句代码,销毁之前的echarts图,就可以正常展示了
const getEchart = () => {
  echarts.init(document.getElementById("tree")).dispose()
  var dom = document.getElementById("tree");
  .....
}


 被折叠的 条评论
为什么被折叠?
被折叠的 条评论
为什么被折叠?
 到【灌水乐园】发言


