


测试环境说明
笔者使用的是搭建在笔记本电脑(性能很差)上的虚拟机,笔记本电脑使用的物理磁盘是 HDD 机械硬盘。该虚拟机拥有 2 个 CPU 核心、3.7G 物理内存、2G swap 区和虚拟化的机械硬盘。
以下测试结果可能存在偏差、失真的情况,不足以得出确切的结论。
1、CPU
CPU 基准测试使用 64 位整数,测试计算质数(或素数)直到某个最大值所需要的时间。使用 --cpu-max-prime=N 选项指定质数生成器的上限,默认为 10000 。
先查看一下 CPU 信息:
$ cat /proc/cpuinfo
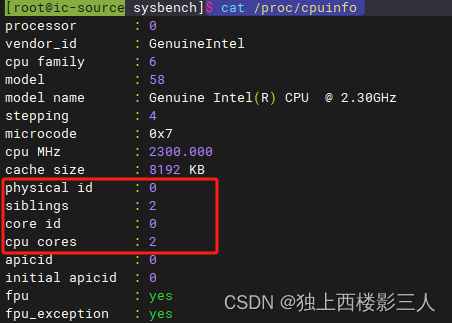
可以看到,笔者的测试虚拟机有两个 CPU 核心。
测试 CPU 性能,修改最大质数为 20000 。
$ sysbench cpu --cpu-max-prime=20000 run
sysbench 1.0.20 (using bundled LuaJIT 2.1.0-beta2)

Running the test with following options:
Number of threads: 1
Initializing random number generator from current time


Prime numbers limit: 20000

Initializing worker threads...

Threads started!

CPU speed:
    events per second:   230.80

General statistics:
    total time:                          10.0040s
    total number of events:              2327

Latency (ms):
         min:                                    4.16
         avg:                                    4.30
         max:                                    5.52
         95th percentile:                        4.41
         sum:                                 9999.46

Threads fairness:
    events (avg/stddev):           2327.0000/0.00
    execution time (avg/stddev):   9.9995/0.00
2、文件 I/O
先查看一下磁盘的基本信息:
$ fdisk -l

磁盘 /dev/sda:53.7 GB, 53687093000 字节,104857600 个扇区
Units = 扇区 of 1 * 512 = 512 bytes
扇区大小(逻辑/物理):512 字节 / 512 字节
I/O 大小(最小/最佳):512 字节 / 512 字节
磁盘标签类型:dos
磁盘标识符:0x000b4260

   设备 Boot      Start         End      Blocks   Id  System
/dev/sda1   *        2048     2099199     1048576   83  Linux
/dev/sda2         2099200   104857599    51379200   83  Linux

磁盘 /dev/mapper/centos-root:50.5 GB, 50457477300 字节,98549760 个扇区
Units = 扇区 of 1 * 512 = 512 bytes
扇区大小(逻辑/物理):512 字节 / 512 字节
I/O 大小(最小/最佳):512 字节 / 512 字节


磁盘 /dev/mapper/centos-swap:2147 MB, 2147483648 字节,4194304 个扇区
Units = 扇区 of 1 * 512 = 512 bytes
扇区大小(逻辑/物理):512 字节 / 512 字节
I/O 大小(最小/最佳):512 字节 / 512 字节

$ lsblk
NAME            MAJ:MIN RM  SIZE RO TYPE MOUNTPOINT
sda               8:0    0   50G  0 disk
├─sda1            8:1    0    1G  0 part /boot
└─sda2            8:2    0   49G  0 part
  ├─centos-root 253:0    0   47G  0 lvm  /
  └─centos-swap 253:1    0    2G  0 lvm  [SWAP]
sr0              11:0    1 1024M  0 rom
$
可以看到扇区单元大小为 512 字节。故下面测试需要指定 --file-block-size=512 。该选项默认值为 16384 。
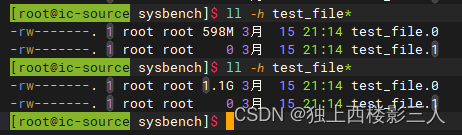
测试分为两个阶段,首先是准备(prepare) 阶段。测试写入时不需要准备阶段。通过下面的命令创建一个数据集:
sysbench fileio --file-total-size=1G prepare
这个命令会在当前工作目录下创建测试文件。
然后是运行(run)阶段将通过读写这些文件进行测试。针对不同的I/O类型有不同的测试选项:
seqwr
顺序写入。seqrewr
顺序重写。其中rewr代表 “rewrite”。seqrd
顺序读取。rndrd
随机读取。rndwr
随机写入。rdnrw
混合随机读/写。
测试时如使用默认值,请注意 fileio 的默认配置:
fileio options:
  --file-num=N                  number of files to create [128]
  --file-block-size=N           block size to use in all IO operations [16384]
  --file-total-size=SIZE        total size of files to create [2G]
  --file-test-mode=STRING       test mode {seqwr, seqrewr, seqrd, rndrd, rndwr, rndrw}
  --file-io-mode=STRING         file operations mode {sync,async,mmap} [sync]
  --file-async-backlog=N        number of asynchronous operatons to queue per thread [128]
  --file-extra-flags=[LIST,...] list of additional flags to use to open files {sync,dsync,direct} []
  --file-fsync-freq=N           do fsync() after this number of requests (0 - don't use fsync()) [100]
  --file-fsync-all[=on|off]     do fsync() after each write operation [off]
  --file-fsync-end[=on|off]     do fsync() at the end of test [on]
  --file-fsync-mode=STRING      which method to use for synchronization {fsync, fdatasync} [fsync]
  --file-merged-requests=N      merge at most this number of IO requests if possible (0 - don't merge) [0]
  --file-rw-ratio=N             reads/writes ratio for combined test [1.5]
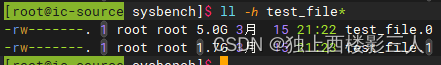
以下所有测试配置的基础选项为:测试文件总大小为 10G,文件总数为 2 ,线程数为 2,测试最大时间为 300s (建议测试时间足够长以防时间到达时指定大小的文件未生成完整),模拟两个客户端的文件 I/O 请求。
2.1 文件块大小为 512B
因为是测试写入,所以没必要 prepare 。
2.1.1 测试顺序写入 seqwr
下面将逐步对一些选项进行分别测试,以找到最佳性能。测试指标顺序写入主要看吞吐量。
1B:其他选线均使用默认值
标题中“B”代表 “Baseline”。
注意此时默认值 --file-fsync-end=on 。
$ sysbench --time=300 --threads=2 fileio --file-total-size=10G --file-num=2 --file-block-size=512 --file-test-mode=seqwr run
sysbench 1.0.20 (using bundled LuaJIT 2.1.0-beta2)

Running the test with following options:
Number of threads: 2
Initializing random number generator from current time


Extra file open flags: (none)
2 files, 5GiB each
10GiB total file size
Block size 512B
Periodic FSYNC enabled, calling fsync() each 100 requests.
Calling fsync() at the end of test, Enabled.
Using synchronous I/O mode
Doing sequential write (creation) test
Initializing worker threads...

Threads started!


File operations:
    reads/s:                      0.00
    writes/s:                     72938.60
    fsyncs/s:                     1458.78

Throughput:
    read, MiB/s:                  0.00
    written, MiB/s:               35.61

General statistics:
    total time:                          300.0256s
    total number of events:              22330893

Latency (ms):
         min:                                    0.00
         avg:                                    0.03
         max:                                  762.05
         95th percentile:                        0.01
         sum:                               590498.93

Threads fairness:
    events (avg/stddev):           11165446.5000/15403.50
    execution time (avg/stddev):   295.2495/0.01
写入吞吐量为 35.61 MB/s 。
另外,在测试过程中发现两个线程并不是并发地分别写入到两个文件中,而是先创建两个空文件,然后写第一个,再写第二个。如果写完第二个文件时仍未到达 time 选项指定的时间,则会覆写第一个文件,以此循环。写入过程中会不断更新文件的元数据,比如文件大小、修改时间等。
1T1:使用 async
标题中“T”代表 “Test”。
基于 1B 测试 --file-io-mode=async 时的性能变化。
$ sysbench --time=300 --threads=2 fileio --file-total-size=10G --file-num=2 --file-block-size=512 --file-test-mode=seqwr run --file-io-mode=async
sysbench 1.0.20 (using bundled LuaJIT 2.1.0-beta2)

Running the test with following options:
Number of threads: 2
Initializing random number generator from current time


Extra file open flags: (none)
2 files, 5GiB each
10GiB total file size
Block size 512B
Periodic FSYNC enabled, calling fsync() each 100 requests.
Calling fsync() at the end of test, Enabled.
Using asynchronous I/O mode
Doing sequential write (creation) test
Initializing worker threads...

Threads started!


File operations:
    reads/s:                      0.00
    writes/s:                     69716.98
    fsyncs/s:                     1394.35

Throughput:
    read, MiB/s:                  0.00
    written, MiB/s:               34.04

General statistics:
    total time:                          300.3779s
    total number of events:              21401348

Latency (ms):
         min:                                    0.00
         avg:                                    0.03
         max:                                 1544.58
         95th percentile:                        0.01
         sum:                               591189.81

Threads fairness:
    events (avg/stddev):           10700674.0000/8615.00
    execution time (avg/stddev):   295.5949/0.00
写入吞吐量为 34.04 MB/s ,对比 1B 性能下降了。
1T2:使用 file-fsync-freq
file-sync-freq 使用默认值 100 。
1T2-1:基于 1B
$ sysbench --time=300 --threads=2 fileio --file-total-size=10G --file-num=2 --file-block-size=512 --file-test-mode=seqwr run --file-fsync-freq=1000
sysbench 1.0.20 (using bundled LuaJIT 2.1.0-beta2)

Running the test with following options:
Number of threads: 2
Initializing random number generator from current time


Extra file open flags: (none)
2 files, 5GiB each
10GiB total file size
Block size 512B
Periodic FSYNC enabled, calling fsync() each 1000 requests.
Calling fsync() at the end of test, Enabled.
Using synchronous I/O mode
Doing sequential write (creation) test
Initializing worker threads...

Threads started!


File operations:
    reads/s:                      0.00
    writes/s:                     72619.56
    fsyncs/s:                     145.25

Throughput:
    read, MiB/s:                  0.00
    written, MiB/s:               35.46

General statistics:
    total time:                          300.0326s
    total number of events:              21838262

Latency (ms):
         min:                                    0.00
         avg:                                    0.03
         max:                                 1068.54
         95th percentile:                        0.01
         sum:                               591649.79

Threads fairness:
    events (avg/stddev):           10919131.0000/58361.00
    execution time (avg/stddev):   295.8249/0.01
写入吞吐量为 35.46 MB/s ,性能略有下降。
1T2-2:基于 1T1
$ sysbench --time=300 --threads=2 fileio --file-total-size=10G --file-num=2 --file-block-size=512 --file-test-mode=seqwr run --file-fsync-freq=10000 --file-io-mode=async
sysbench 1.0.20 (using bundled LuaJIT 2.1.0-beta2)

Running the test with following options:
Number of threads: 2
Initializing random number generator from current time


Extra file open flags: (none)
2 files, 5GiB each
10GiB total file size
Block size 512B
Periodic FSYNC enabled, calling fsync() each 1000 requests.
Calling fsync() at the end of test, Enabled.
Using asynchronous I/O mode
Doing sequential write (creation) test
Initializing worker threads...

Threads started!


File operations:
    reads/s:                      0.00
    writes/s:                     70541.87
    fsyncs/s:                     141.09

Throughput:
    read, MiB/s:                  0.00
    written, MiB/s:               34.44

General statistics:
    total time:                          300.0306s
    total number of events:              21215034

Latency (ms):
         min:                                    0.00
         avg:                                    0.03
         max:                                  730.71
         95th percentile:                        0.01
         sum:                               592107.01

Threads fairness:
    events (avg/stddev):           10607517.0000/215686.00
    execution time (avg/stddev):   296.0535/0.08
写入吞吐量为 34.44 MB/s ,对比 1T1 性能提升了;但对比 1T-2 性能仍下降了。由此可见,顺序写入并不能从异步 I/O async 获益,甚至会引起性能下降。
2.1.2 测试随机读写 rndrw
因应用尤其是数据库的 I/O 瓶颈通常为随机 I/O (特别是在使用传统机械硬盘作为数据存储时),故以下重点对随机读写进行测试。
随机 I/O 的测试指标与顺序 I/O 不同,更看重次数,即每秒 IO 操作次数 (IOPS)。 有关这点,查看机械、SSD 硬盘的产品规格即可印证。而这在 sysbench-1.20 的输出中没有直接显示,需要自行计算,计算公式为 "total number of events" / "time" ,time 在本例中为 300 。为了简便,我们直接比较 total number of events ,后文称之为 “总请求数”。
此外,额外使用“延迟”中的 95th percentile 作为另一个测试指标,以反应大部分请求的响应时间。后文将以“响应时间”代指它。
测试 rndrw 需要 prepare :
$ sysbench --threads=2 fileio --file-total-size=10G --file-num=2 --file-block-size=512 prepare
2B:其他选项均使用默认值
$ sysbench --time=300 --threads=2 fileio --file-total-size=10G --file-num=2 --file-block-size=512 --file-test-mode=rndrw run
sysbench 1.0.20 (using bundled LuaJIT 2.1.0-beta2)

Running the test with following options:
Number of threads: 2
Initializing random number generator from current time


Extra file open flags: (none)
2 files, 5GiB each
10GiB total file size
Block size 512B
Number of IO requests: 0
Read/Write ratio for combined random IO test: 1.50
Periodic FSYNC enabled, calling fsync() each 100 requests.
Calling fsync() at the end of test, Enabled.
Using synchronous I/O mode
Doing random r/w test
Initializing worker threads...

Threads started!


File operations:
    reads/s:                      58.42
    writes/s:                     38.95
    fsyncs/s:                     1.96

Throughput:
    read, MiB/s:                  0.03
    written, MiB/s:               0.02

General statistics:
    total time:                          300.0184s
    total number of events:              29797

Latency (ms):
         min:                                    0.00
         avg:                                   20.13
         max:                                  988.55
         95th percentile:                       59.99
         sum:                               599958.77

Threads fairness:
    events (avg/stddev):           14898.5000/97.50
    execution time (avg/stddev):   299.9794/0.01
- total number of events: 29797
- avg: 20.13
- 95th percentile: 59.99
2T1:file-fsync-all=on
file-fsync-all 选项默认为 off ,开启它表示每次写操作后都做一次 fsync 。
file-fsync-all=on :
$ sysbench --time=300 --threads=2 fileio --file-total-size=10G --file-num=2 --file-block-size=512 --file-test-mode=rndrw run --file-fsync-all=on
sysbench 1.0.20 (using bundled LuaJIT 2.1.0-beta2)

Running the test with following options:
Number of threads: 2
Initializing random number generator from current time


Extra file open flags: (none)
2 files, 5GiB each
10GiB total file size
Block size 512B
Number of IO requests: 0
Read/Write ratio for combined random IO test: 1.50
Calling fsync() after each write operation.
Using synchronous I/O mode
Doing random r/w test
Initializing worker threads...

Threads started!


File operations:
    reads/s:                      56.92
    writes/s:                     37.94
    fsyncs/s:                     37.94

Throughput:
    read, MiB/s:                  0.03
    written, MiB/s:               0.02

General statistics:
    total time:                          300.0233s
    total number of events:              28461

Latency (ms):
         min:                                    0.00
         avg:                                   21.08
         max:                                  961.86
         95th percentile:                       57.87
         sum:                               599971.97

Threads fairness:
    events (avg/stddev):           14230.5000/3.50
    execution time (avg/stddev):   299.9860/0.01
- total number of events: 28461
- avg: 21.08
- 95th percentile: 57.87
对比 2B,总请求数略有减少,但平均响应时间、95%响应时间却略有减少。性能略有下降。
2T2:调整 file-fsync-freq
2T2-1:减小 file-fsync-freq
file-fsync-freq 选项默认为 100 ,表示每多少次请求后做一次 fsync 。设置 file-fsync-freq=1 并进行如下测试。
正常来讲,这个配置的 I/O 性能应该是最差的,因为每次请求都调用一次 fsync 刷入磁盘,而 file-fsync-freq > 1 时可以在换从中合并多个随机 I/O 为顺序 I/O,提高读写 I/O 性能。可笔者“实际”测试却恰恰相反,初步怀疑是操作系统内核、默认配置、虚拟机默认的磁盘配置、内存过小等原因造成的,暂不予深究,之后有时间再行分析。
file-fsync-freq=1:
$ sysbench --time=300 --threads=2 fileio --file-total-size=10G --file-num=2 --file-block-size=512 --file-test-mode=rndrw run --file-fsync-freq=1
sysbench 1.0.20 (using bundled LuaJIT 2.1.0-beta2)

Running the test with following options:
Number of threads: 2
Initializing random number generator from current time


Extra file open flags: (none)
2 files, 5GiB each
10GiB total file size
Block size 512B
Number of IO requests: 0
Read/Write ratio for combined random IO test: 1.50
Periodic FSYNC enabled, calling fsync() each 1 requests.
Calling fsync() at the end of test, Enabled.
Using synchronous I/O mode
Doing random r/w test
Initializing worker threads...

Threads started!


File operations:
    reads/s:                      51.09
    writes/s:                     34.06
    fsyncs/s:                     68.14

Throughput:
    read, MiB/s:                  0.02
    written, MiB/s:               0.02

General statistics:
    total time:                          300.0141s
    total number of events:              45989

Latency (ms):
         min:                                    0.00
         avg:                                   13.04
         max:                                  960.19
         95th percentile:                       38.25
         sum:                               599925.83

Threads fairness:
    events (avg/stddev):           22994.5000/204.50
    execution time (avg/stddev):   299.9629/0.01
- total number of events: 45989
- avg: 13.04
- 95th percentile: 38.25
对比 2B,总请求数显著增加,平均响应时间、95%响应时间也显著减少。性能明显提升。但每秒文件读写操作数却减少了。
注意此时 fsync 次数约为每秒 1 次,符合 InnoDB 设置 innodb_flush_log_at_trx_commit=0 且 innodb-flush-log-at-timeout 为默认值 1 时的情况。
2T2-2:增加 file-fsync-freq
基于 2B 修改:
$ sysbench --time=300 --threads=2 fileio --file-total-size=10G --file-num=2 --file-block-size=512 --file-test-mode=rndrw run --file-fsync-freq=150
sysbench 1.0.20 (using bundled LuaJIT 2.1.0-beta2)

Running the test with following options:
Number of threads: 2
Initializing random number generator from current time


Extra file open flags: (none)
2 files, 5GiB each
10GiB total file size
Block size 512B
Number of IO requests: 0
Read/Write ratio for combined random IO test: 1.50
Periodic FSYNC enabled, calling fsync() each 150 requests.
Calling fsync() at the end of test, Enabled.
Using synchronous I/O mode
Doing random r/w test
Initializing worker threads...

Threads started!


File operations:
    reads/s:                      45.53
    writes/s:                     30.35
    fsyncs/s:                     1.02

Throughput:
    read, MiB/s:                  0.02
    written, MiB/s:               0.01

General statistics:
    total time:                          300.0069s
    total number of events:              23068

Latency (ms):
         min:                                    0.00
         avg:                                   26.01
         max:                                 1067.99
         95th percentile:                       74.46
         sum:                               599921.35

Threads fairness:
    events (avg/stddev):           11534.0000/54.00
    execution time (avg/stddev):   299.9607/0.00
IOPS 如下:
- total number of events: 23068
- avg: 26.01
- 95th percentile: 74.46
相比 2B,总请求数显著减少,响应时间显著增加。性能显著下降了。
注意,file-fsync-freq 不能与 file-fsync-all 一起使用,否则会被忽略。
$ sysbench --time=300 --threads=2 fileio --file-total-size=10G --file-num=2 --file-block-size=512 --file-test-mode=rndrw run --file-fsync-all=on --file-fsync-freq=40
sysbench 1.0.20 (using bundled LuaJIT 2.1.0-beta2)

Running the test with following options:
Number of threads: 2
Initializing random number generator from current time


Extra file open flags: (none)
2 files, 5GiB each
10GiB total file size
Block size 512B
Number of IO requests: 0
Read/Write ratio for combined random IO test: 1.50
Calling fsync() after each write operation.
Using synchronous I/O mode
Doing random r/w test
Initializing worker threads...

Threads started!
可以看到,执行信息里没有诸如 Periodic FSYNC enabled, calling fsync() each 40 requests. 这样的内容,只有 Calling fsync() after each write operation. 。证明只有 file-fsync-all 生效了。
2T3:使用 async
测试至此,2T2-1 为最优结果,故下面以它为参照。
基于 2T2-1 ,测试 --file-io-mode=async 时的性能变化。
$ sysbench --time=300 --threads=2 fileio --file-total-size=10G --file-num=2 --file-block-size=512 --file-test-mode=rndrw run --file-fsync-freq=1 --file-io-mode=async
sysbench 1.0.20 (using bundled LuaJIT 2.1.0-beta2)

Running the test with following options:
Number of threads: 2
Initializing random number generator from current time


Extra file open flags: (none)
2 files, 5GiB each
10GiB total file size
Block size 512B
Number of IO requests: 0
Read/Write ratio for combined random IO test: 1.50
Periodic FSYNC enabled, calling fsync() each 1 requests.
Calling fsync() at the end of test, Enabled.
Using asynchronous I/O mode
Doing random r/w test
Initializing worker threads...

Threads started!


File operations:
    reads/s:                      43.45
    writes/s:                     29.30
    fsyncs/s:                     58.62

Throughput:
    read, MiB/s:                  0.02
    written, MiB/s:               0.01

General statistics:
    total time:                          300.2207s
    total number of events:              39437

Latency (ms):
         min:                                    0.00
         avg:                                   15.22
         max:                                  904.93
         95th percentile:                       56.84
         sum:                               600336.15

Threads fairness:
    events (avg/stddev):           19718.5000/94.50
    execution time (avg/stddev):   300.1681/0.00
- total number of events: 39437
- avg: 15.22
- 95th percentile: 56.84
对比 2T2-1,总请求数显著减少,平均和%95响应时间显著增加。性能显著下降了。
2T4:调整 file-async-backlog
file-async-backlog 表示每个线程要排队的异步操作数,默认值为 128 ,似乎与 file-num 的默认值 128 对应。所以,下面我们尝试修改它为 2,看看结果如何。
基于 2T3 :
$ sysbench --time=300 --threads=2 fileio --file-total-size=10G --file-num=2 --file-block-size=512 --file-test-mode=rndrw run --file-fsync-freq=1 --file-io-mode=async --file-async-backlog=2
sysbench 1.0.20 (using bundled LuaJIT 2.1.0-beta2)

Running the test with following options:
Number of threads: 2
Initializing random number generator from current time


Extra file open flags: (none)
2 files, 5GiB each
10GiB total file size
Block size 512B
Number of IO requests: 0
Read/Write ratio for combined random IO test: 1.50
Periodic FSYNC enabled, calling fsync() each 1 requests.
Calling fsync() at the end of test, Enabled.
Using asynchronous I/O mode
Doing random r/w test
Initializing worker threads...

Threads started!


File operations:
    reads/s:                      46.87
    writes/s:                     31.25
    fsyncs/s:                     62.50

Throughput:
    read, MiB/s:                  0.02
    written, MiB/s:               0.02

General statistics:
    total time:                          300.0433s
    total number of events:              42189

Latency (ms):
         min:                                    0.00
         avg:                                   14.22
         max:                                  999.98
         95th percentile:                       46.63
         sum:                               599961.22

Threads fairness:
    events (avg/stddev):           21094.5000/40.50
    execution time (avg/stddev):   299.9806/0.01
-
total number of events: 42189
-
avg: 14.22
-
95th percentile: 46.63
-
对比 2T3,总请求数略有增加,平均响应时间略有减少,95%响应时间显著减少。性能略有上升。
-
对比 2T2-1,总请求数显著减少,平均响应时间略有增加,95%响应时间显著增加。性能显著下降。
证明使用异步 IO 并未引起性能提升,反而下降了。
2T5:使用 file-merged-requests
此时,2T2-1 仍为最优,故仍以此为基线,尝试进一步提升性能。2T2-1 的测试结果中 45989 / 300 ≈ 153.3,故我们设置 file-merged-requests=160 。
$ sysbench --time=300 --threads=2 fileio --file-total-size=10G --file-num=2 --file-block-size=512 --file-test-mode=rndrw run --file-fsync-freq=1 --file-merged-requests=160
sysbench 1.0.20 (using bundled LuaJIT 2.1.0-beta2)

Running the test with following options:
Number of threads: 2
Initializing random number generator from current time


Extra file open flags: (none)
2 files, 5GiB each
10GiB total file size
Block size 512B
Merging requests up to 80KiB for sequential IO.
Number of IO requests: 0
Read/Write ratio for combined random IO test: 1.50
Periodic FSYNC enabled, calling fsync() each 1 requests.
Calling fsync() at the end of test, Enabled.
Using synchronous I/O mode
Doing random r/w test
Initializing worker threads...

Threads started!


File operations:
    reads/s:                      40.77
    writes/s:                     27.18
    fsyncs/s:                     54.37

Throughput:
    read, MiB/s:                  0.02
    written, MiB/s:               0.01

General statistics:
    total time:                          300.0027s
    total number of events:              36694

Latency (ms):
         min:                                    0.00
         avg:                                   16.35
         max:                                 1058.73
         95th percentile:                       54.83
         sum:                               599910.22

Threads fairness:
    events (avg/stddev):           18347.0000/12.00
    execution time (avg/stddev):   299.9551/0.00
- total number of events: 36694
- avg: 16.35
- 95th percentile: 54.83
对比 2T2-1,虽然可以看到 Merging requests up to 80KiB for sequential IO. 将多个随机 I/O 合并为顺序 I/O,但总请求数仍显著减少,平均响应时间显著增加,95%响应时间也显著增加。性能显著降低。
2T6:使用 fdatasync
2T6-1:基于 2B
$ sysbench --time=300 --threads=2 fileio --file-total-size=10G --file-num=2 --file-block-size=512 --file-test-mode=rndrw run --file-fsync-mode=fdatasync
sysbench 1.0.20 (using bundled LuaJIT 2.1.0-beta2)

Running the test with following options:
Number of threads: 2
Initializing random number generator from current time


Extra file open flags: (none)
2 files, 5GiB each
10GiB total file size
Block size 512B
Number of IO requests: 0
Read/Write ratio for combined random IO test: 1.50
Periodic FSYNC enabled, calling fsync() each 100 requests.
Calling fsync() at the end of test, Enabled.
Using synchronous I/O mode
Doing random r/w test
Initializing worker threads...

Threads started!


File operations:
    reads/s:                      57.40
    writes/s:                     38.27
    fsyncs/s:                     1.93

Throughput:
    read, MiB/s:                  0.03
    written, MiB/s:               0.02

General statistics:
    total time:                          300.0671s
    total number of events:              29281

Latency (ms):
         min:                                    0.00
         avg:                                   20.49
         max:                                  990.92
         95th percentile:                       62.19
         sum:                               600055.06

Threads fairness:
    events (avg/stddev):           14640.5000/26.50
    execution time (avg/stddev):   300.0275/0.00
- total number of events: 29281
- avg: 20.49
- 95th percentile: 62.19
对比 2B,总请求数略微减少,平均响应时间略微增加,响应时间略有增加。性能稍微降低了。
2T6-2:基于 2T2-1
$ sysbench --time=300 --threads=2 fileio --file-total-size=10G --file-num=2 --file-block-size=512 --file-test-mode=rndrw run --file-fsync-freq=1 --file-fsync-mode=fdatasync
sysbench 1.0.20 (using bundled LuaJIT 2.1.0-beta2)

Running the test with following options:
Number of threads: 2
Initializing random number generator from current time


Extra file open flags: (none)
2 files, 5GiB each
10GiB total file size
Block size 512B
Number of IO requests: 0
Read/Write ratio for combined random IO test: 1.50
Periodic FSYNC enabled, calling fsync() each 1 requests.
Calling fsync() at the end of test, Enabled.
Using synchronous I/O mode
Doing random r/w test
Initializing worker threads...

Threads started!


File operations:
    reads/s:                      51.88
    writes/s:                     34.59
    fsyncs/s:                     69.19

Throughput:
    read, MiB/s:                  0.03
    written, MiB/s:               0.02

General statistics:
    total time:                          300.0144s
    total number of events:              46698

Latency (ms):
         min:                                    0.00
         avg:                                   12.85
         max:                                  960.98
         95th percentile:                       47.47
         sum:                               599922.94

Threads fairness:
    events (avg/stddev):           23349.0000/23.00
    execution time (avg/stddev):   299.9615/0.00
- total number of events: 46698
- avg: 12.85
- 95th percentile: 47.47
对比 2T2-1,总请求数略有增加,平均响应时间稍微减少,95%响应时间显著增加。性能略有提升。至此,rndrw 测试中本测试结果为最佳。
2.2 文件块大小为 16K
接下来仅对上面测试的最优的随机读写配置 再做优化测试。
2.2.1 测试顺序写入 seqwr
测试内存块大小为 16KB 时的内存读写性能。
3T1:对比 1B
$ sysbench --time=300 --threads=2 fileio --file-total-size=10G --file-num=2 --file-block-size=16K --file-test-mode=seqwr run
sysbench 1.0.20 (using bundled LuaJIT 2.1.0-beta2)

Running the test with following options:
Number of threads: 2
Initializing random number generator from current time


Extra file open flags: (none)
2 files, 5GiB each
10GiB total file size
Block size 16KiB
Periodic FSYNC enabled, calling fsync() each 100 requests.
Calling fsync() at the end of test, Enabled.
Using synchronous I/O mode
Doing sequential write (creation) test
Initializing worker threads...

Threads started!


File operations:
    reads/s:                      0.00
    writes/s:                     2379.17
    fsyncs/s:                     47.59

Throughput:
    read, MiB/s:                  0.00
    written, MiB/s:               37.17

General statistics:
    total time:                          300.0183s
    total number of events:              728075

Latency (ms):
         min:                                    0.00
         avg:                                    0.82
         max:                                 3171.58
         95th percentile:                        0.05
         sum:                               599503.06

Threads fairness:
    events (avg/stddev):           364037.5000/811.50
    execution time (avg/stddev):   299.7515/0.00
对比 1B,写入吞吐量为 37.17 MB/s,性能略有提升。但平均和95%响应时间却显著增加了。
2.2.2 测试随机读写 rndrw
3T2:对比 2T6-2
准备一个块大小为 16K 的测试文件。
$ sysbench --threads=2 fileio --file-total-size=10G --file-num=2 --file-block-size=16K prepare
也可以不使用 --file-block-size=16K ,因为 16K 本就是该选项的默认值。
$ sysbench --time=300 --threads=2 fileio --file-total-size=10G --file-num=2 --file-block-size=16K --file-test-mode=rndrw run --file-fsync-freq=1 --file-fsync-mode=fdatasync
sysbench 1.0.20 (using bundled LuaJIT 2.1.0-beta2)

Running the test with following options:
Number of threads: 2
Initializing random number generator from current time


Extra file open flags: (none)
2 files, 5GiB each
10GiB total file size
Block size 16KiB
Number of IO requests: 0
Read/Write ratio for combined random IO test: 1.50
Periodic FSYNC enabled, calling fsync() each 1 requests.
Calling fsync() at the end of test, Enabled.
Using synchronous I/O mode
Doing random r/w test
Initializing worker threads...

Threads started!


File operations:
    reads/s:                      65.39
    writes/s:                     43.59
    fsyncs/s:                     87.20

Throughput:
    read, MiB/s:                  1.02
    written, MiB/s:               0.68

General statistics:
    total time:                          300.0973s
    total number of events:              58871

Latency (ms):
         min:                                    0.00
         avg:                                   10.19
         max:                                 1642.47
         95th percentile:                       34.33
         sum:                               600072.54

Threads fairness:
    events (avg/stddev):           29435.5000/46.50
    execution time (avg/stddev):   300.0363/0.00
- total number of events: 58871
- avg: 10.19
- 95th percentile: 34.33
对比 2T6-2,总请求数显著增加,平均响应时间显著减少,95%响应时间显著减少。性能显著提升。
2.3 小结
综上,笔者测试的最优测试结果为 3T2:--file-block-size=16K --file-fsync-freq=1 --file-fsync-mode=fdatasync 。
3、内存
笔者的测试虚拟机的内存大小为 3.7G ,swap 区大小为 2G 。
3.1 顺序写入
$ sysbench memory --memory-block-size=16K --memory-total-size=2G run
sysbench 1.0.20 (using bundled LuaJIT 2.1.0-beta2)

Running the test with following options:
Number of threads: 1
Initializing random number generator from current time


Running memory speed test with the following options:
  block size: 16KiB
  total size: 2048MiB
  operation: write
  scope: global

Initializing worker threads...

Threads started!

Total operations: 131072 (581340.94 per second)

2048.00 MiB transferred (9083.45 MiB/sec)


General statistics:
    total time:                          0.2231s
    total number of events:              131072

Latency (ms):
         min:                                    0.00
         avg:                                    0.00
         max:                                    0.17
         95th percentile:                        0.00
         sum:                                  197.38

Threads fairness:
    events (avg/stddev):           131072.0000/0.00
    execution time (avg/stddev):   0.1974/0.00
3.2 顺序读取
$ sysbench memory --memory-block-size=16K --memory-total-size=2G --memory-oper=read run
sysbench 1.0.20 (using bundled LuaJIT 2.1.0-beta2)

Running the test with following options:
Number of threads: 1
Initializing random number generator from current time


Running memory speed test with the following options:
  block size: 16KiB
  total size: 2048MiB
  operation: read
  scope: global

Initializing worker threads...

Threads started!

Total operations: 131072 (1361140.38 per second)

2048.00 MiB transferred (21267.82 MiB/sec)


General statistics:
    total time:                          0.0940s
    total number of events:              131072

Latency (ms):
         min:                                    0.00
         avg:                                    0.00
         max:                                    0.18
         95th percentile:                        0.00
         sum:                                   70.39

Threads fairness:
    events (avg/stddev):           131072.0000/0.00
    execution time (avg/stddev):   0.0704/0.00
3.3 随机写入
$ sysbench memory --memory-block-size=16K --memory-total-size=2G --memory-access-mode=rnd run
sysbench 1.0.20 (using bundled LuaJIT 2.1.0-beta2)

Running the test with following options:
Number of threads: 1
Initializing random number generator from current time


Running memory speed test with the following options:
  block size: 16KiB
  total size: 2048MiB
  operation: write
  scope: global

Initializing worker threads...

Threads started!

Total operations: 131072 (94320.51 per second)

2048.00 MiB transferred (1473.76 MiB/sec)


General statistics:
    total time:                          1.3873s
    total number of events:              131072

Latency (ms):
         min:                                    0.01
         avg:                                    0.01
         max:                                    0.22
         95th percentile:                        0.01
         sum:                                 1359.07

Threads fairness:
    events (avg/stddev):           131072.0000/0.00
    execution time (avg/stddev):   1.3591/0.00
3.4 随机读取
$ sysbench memory --memory-block-size=16K --memory-total-size=2G --memory-access-mode=rnd --memory-oper=write run
sysbench 1.0.20 (using bundled LuaJIT 2.1.0-beta2)

Running the test with following options:
Number of threads: 1
Initializing random number generator from current time


Running memory speed test with the following options:
  block size: 16KiB
  total size: 2048MiB
  operation: write
  scope: global

Initializing worker threads...

Threads started!

Total operations: 131072 (94733.62 per second)

2048.00 MiB transferred (1480.21 MiB/sec)


General statistics:
    total time:                          1.3813s
    total number of events:              131072

Latency (ms):
         min:                                    0.01
         avg:                                    0.01
         max:                                    0.25
         95th percentile:                        0.01
         sum:                                 1353.19

Threads fairness:
    events (avg/stddev):           131072.0000/0.00
    execution time (avg/stddev):   1.3532/0.00
4、线程
两线程:
$ sysbench threads --threads=2 run
sysbench 1.0.20 (using bundled LuaJIT 2.1.0-beta2)

Running the test with following options:
Number of threads: 2
Initializing random number generator from current time


Initializing worker threads...

Threads started!


General statistics:
    total time:                          10.0007s
    total number of events:              24590

Latency (ms):
         min:                                    0.70
         avg:                                    0.81
         max:                                    4.88
         95th percentile:                        1.18
         sum:                                19977.52

Threads fairness:
    events (avg/stddev):           12295.0000/22.00
    execution time (avg/stddev):   9.9888/0.00
四线程:
$ sysbench threads --threads=4 run
sysbench 1.0.20 (using bundled LuaJIT 2.1.0-beta2)

Running the test with following options:
Number of threads: 4
Initializing random number generator from current time


Initializing worker threads...

Threads started!


General statistics:
    total time:                          10.1937s
    total number of events:              17597

Latency (ms):
         min:                                    0.82
         avg:                                    2.29
         max:                                  193.69
         95th percentile:                        3.07
         sum:                                40367.02

Threads fairness:
    events (avg/stddev):           4399.2500/15.93
    execution time (avg/stddev):   10.0918/0.10
八线程:
$ sysbench threads --threads=8 run
sysbench 1.0.20 (using bundled LuaJIT 2.1.0-beta2)

Running the test with following options:
Number of threads: 8
Initializing random number generator from current time


Initializing worker threads...

Threads started!


General statistics:
    total time:                          10.0059s
    total number of events:              11374

Latency (ms):
         min:                                    0.74
         avg:                                    7.03
         max:                                  223.72
         95th percentile:                       23.10
         sum:                                79953.72

Threads fairness:
    events (avg/stddev):           1421.7500/35.77
    execution time (avg/stddev):   9.9942/0.01
因为测试环境只有两个 CPU,因而两线程时性能是最佳的。
5、POSIX 互斥
$ sysbench mutex --threads=2 run
sysbench 1.0.20 (using bundled LuaJIT 2.1.0-beta2)

Running the test with following options:
Number of threads: 2
Initializing random number generator from current time


Initializing worker threads...

Threads started!


General statistics:
    total time:                          0.2546s
    total number of events:              2

Latency (ms):
         min:                                  254.01
         avg:                                  254.22
         max:                                  254.43
         95th percentile:                      253.35
         sum:                                  508.44

Threads fairness:
    events (avg/stddev):           1.0000/0.00
    execution time (avg/stddev):   0.2542/0.00


 981
981

 被折叠的 条评论
为什么被折叠?
被折叠的 条评论
为什么被折叠?
 到【灌水乐园】发言


