


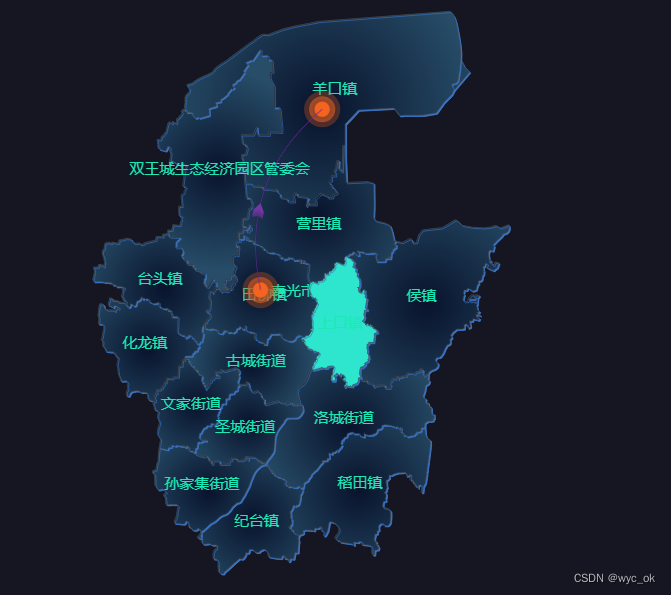
效果图:
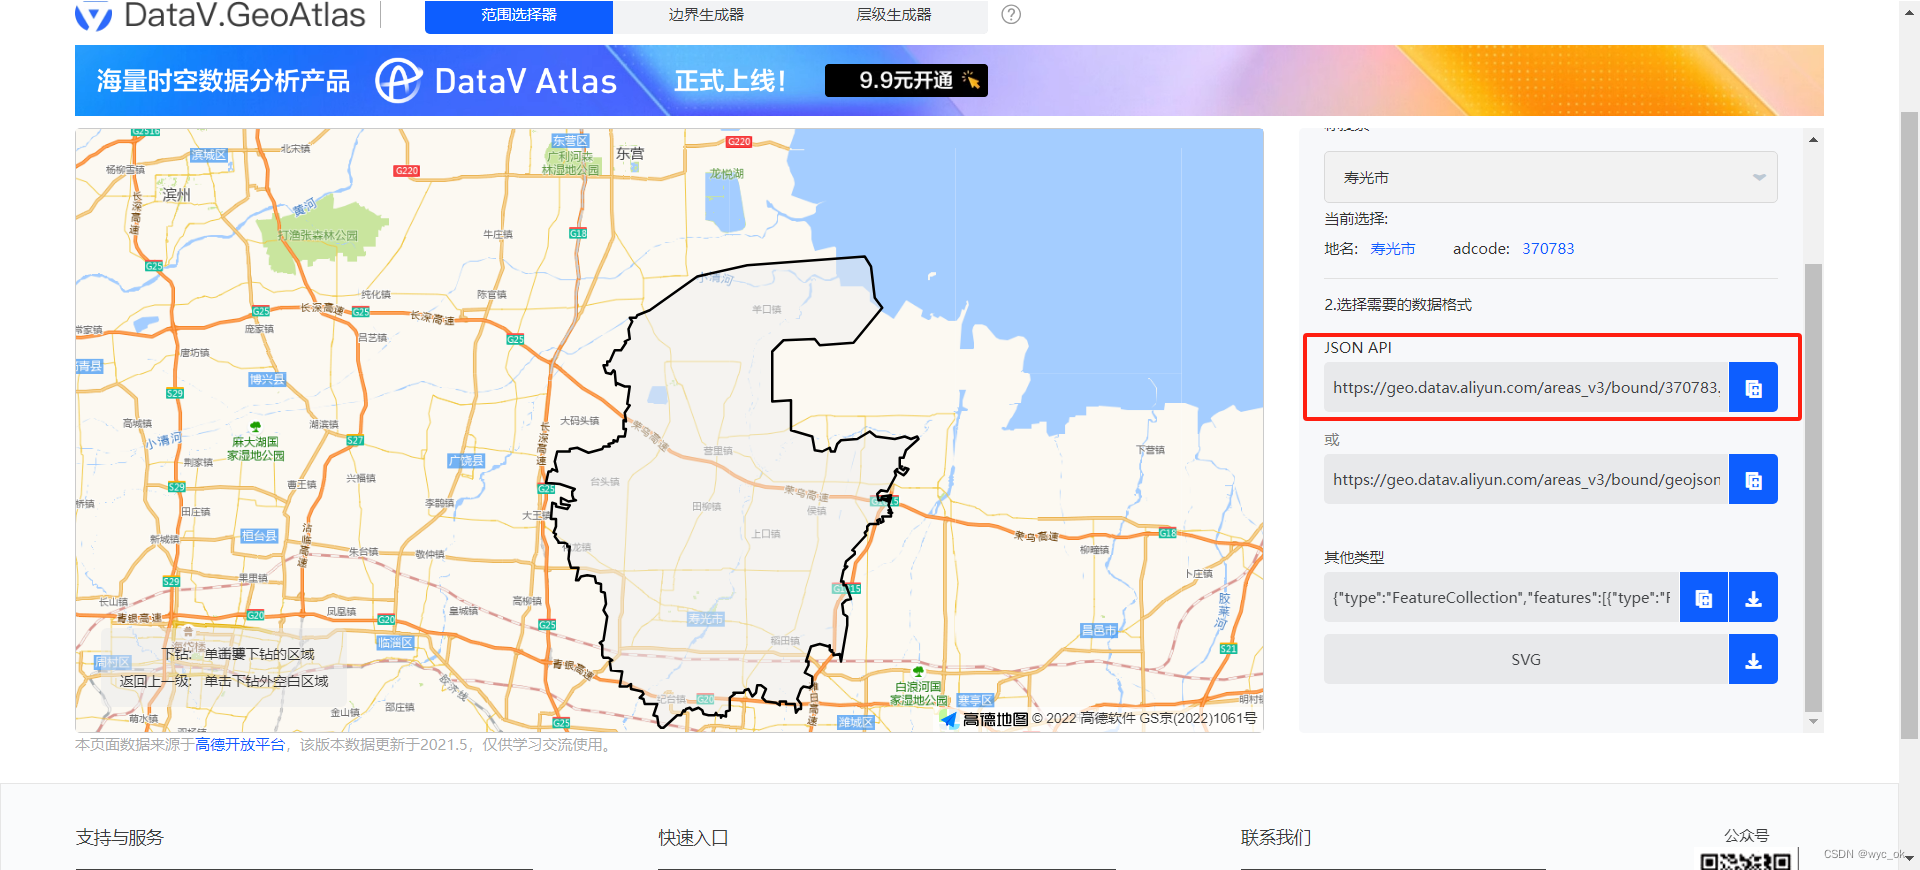
一、获取市的地图数据
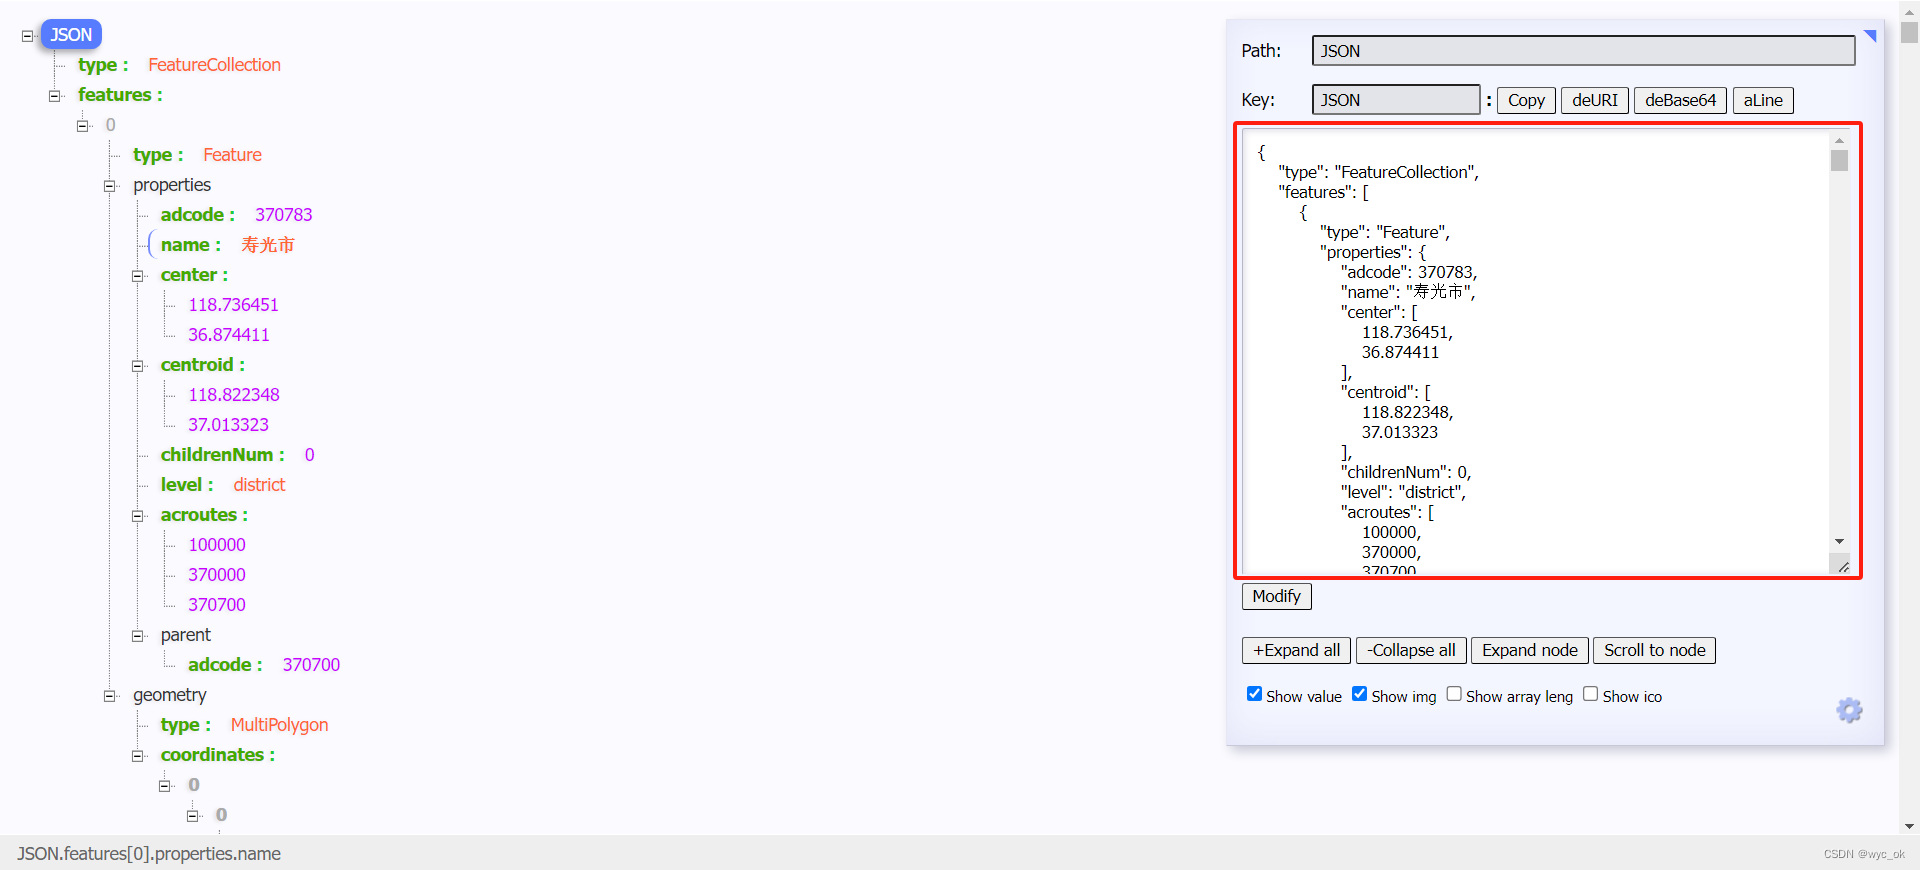
点击地图缩放至想要的市区域,通过右侧的链接打开网址,复制json数据。
 二、获取镇地图数据
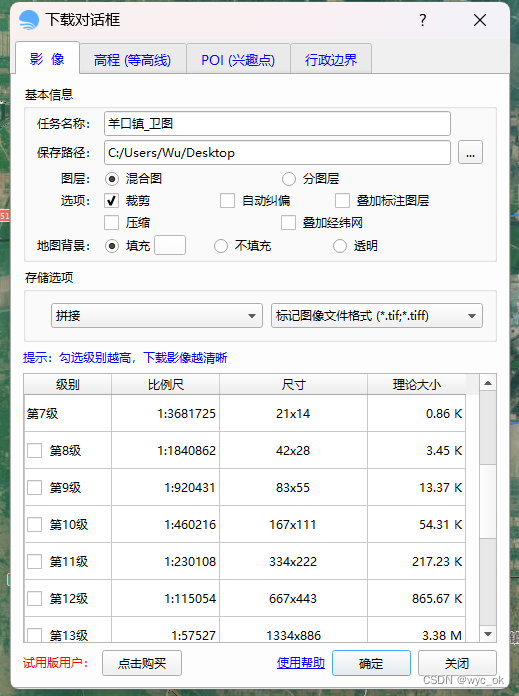
下载软件bigemap

选择你想要的镇数据,点击下载
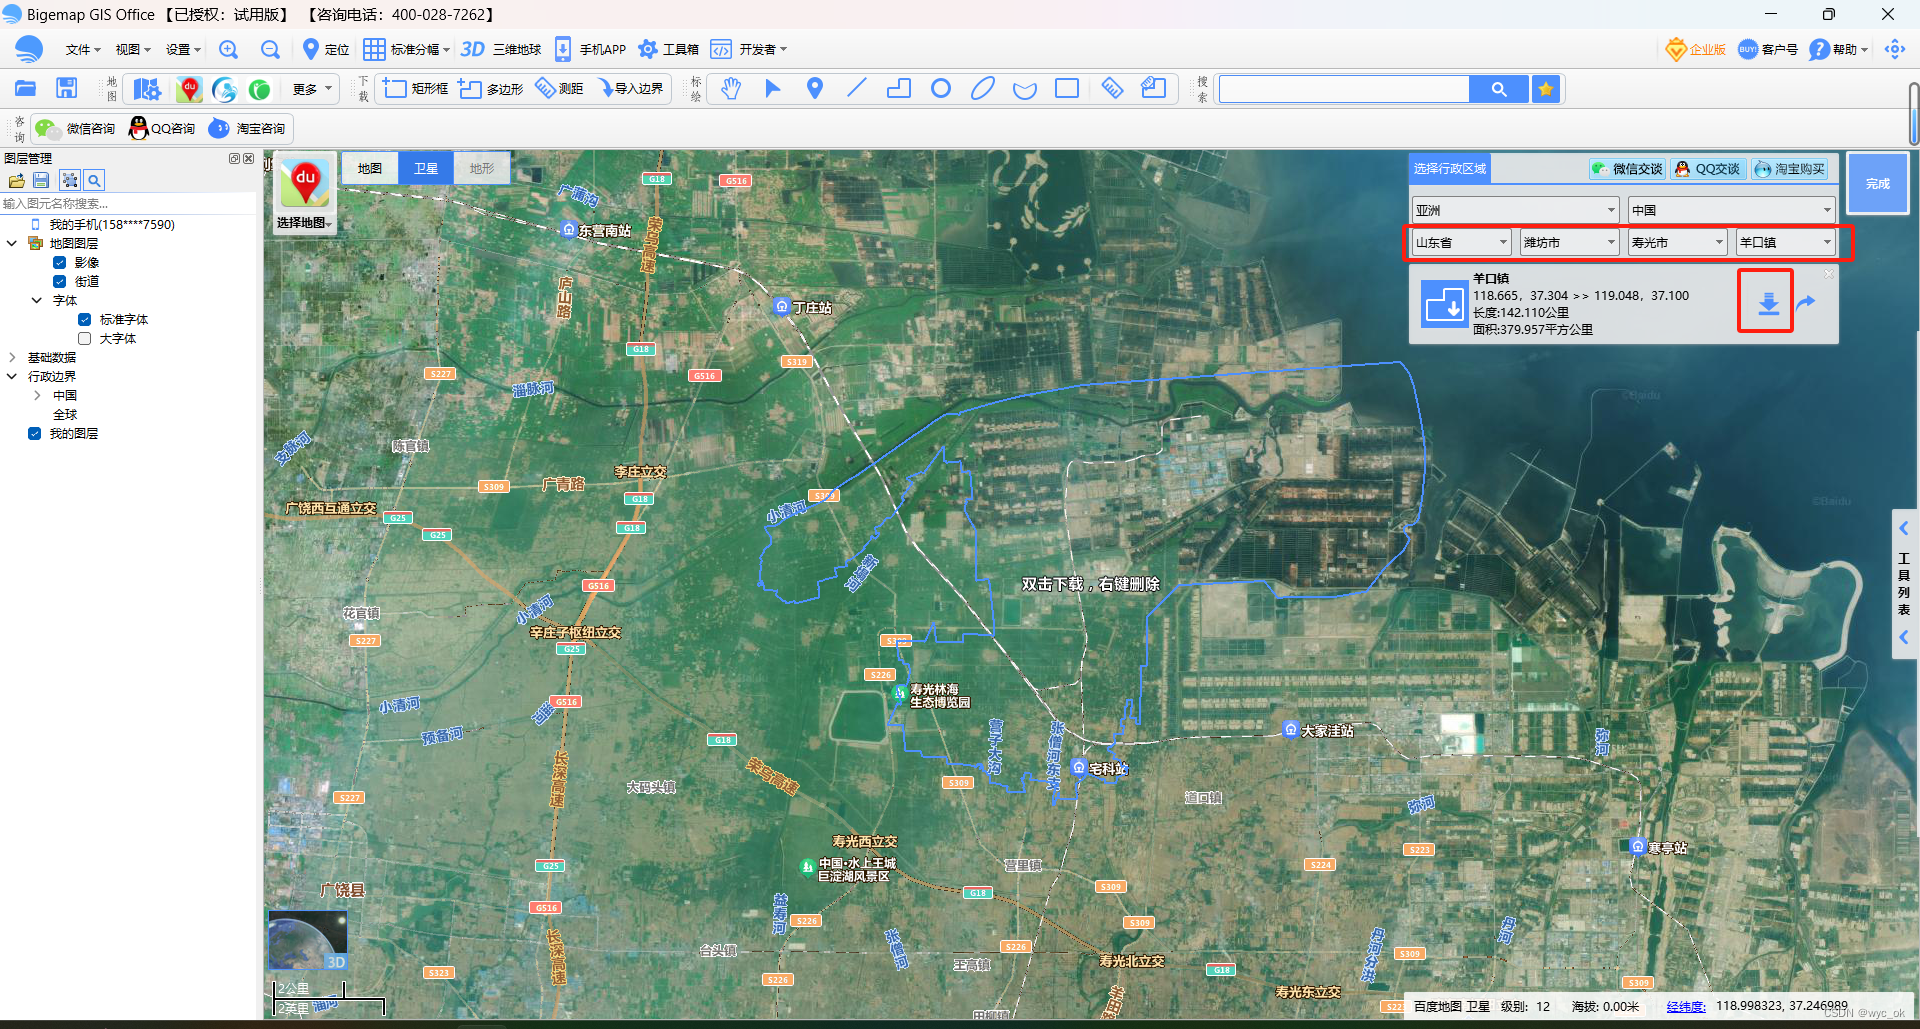
选择级别(清晰度)
三、合并市和镇的数据
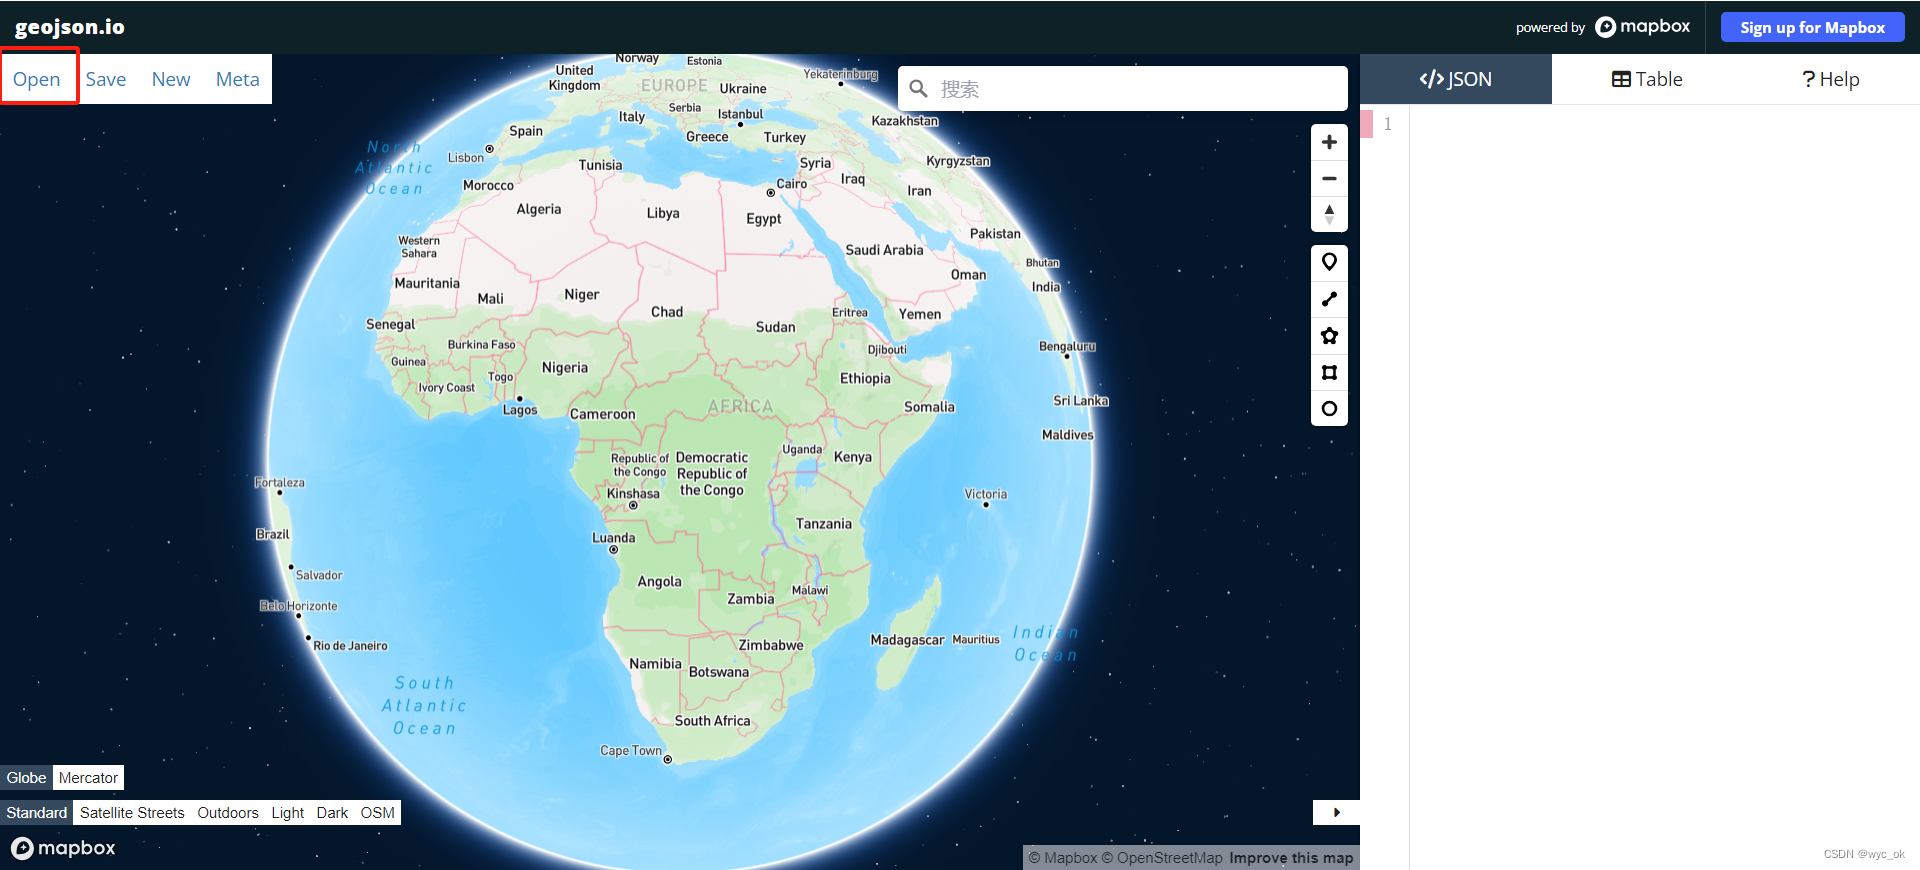
通过 合并转化数据(geojson)geojson.io 网址合并json数据
首先将市json数据复制到这里

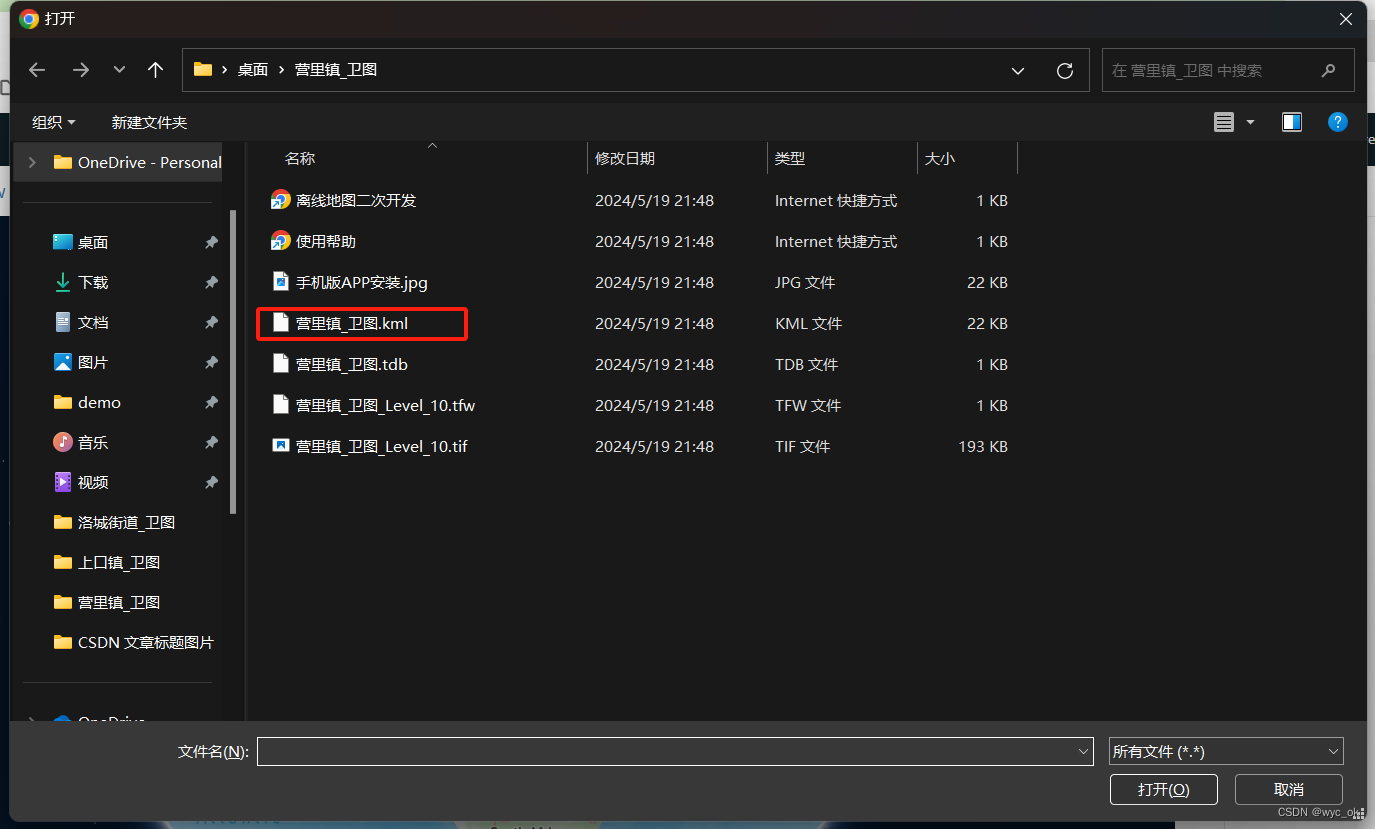
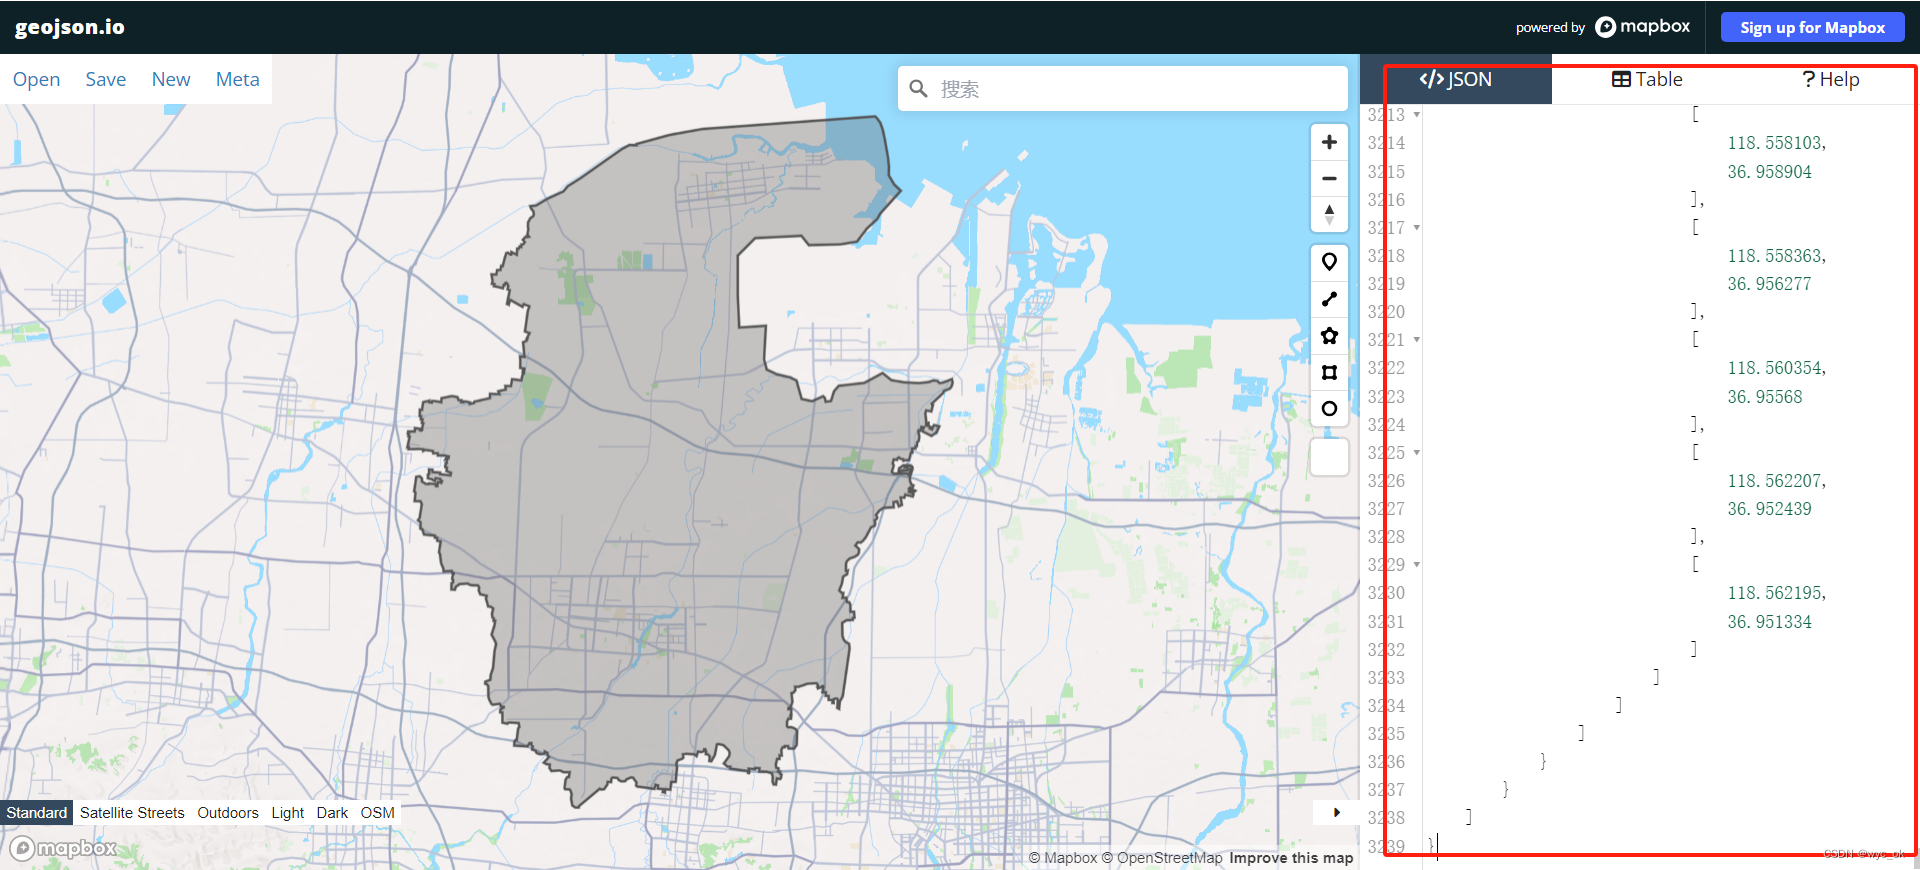
然后通过 open 打开镇文件夹中的 .kml 文件,即可实现镇和市的合并json操作
最后将合并好的json数据放到 map.json 文件夹中等待使用
将 json 数据复制放进Vue 项目的 /static/map.json 地址中
下载 echarts :
npm i echarts --save
npm i axios --save
main.js 注册
import { createApp } from 'vue'
import * as echarts from 'echarts';
import './style.css'
import App from './App.vue'

const app = createApp(App)
app.config.globalProperties.$echarts = echarts;

app.mount('#app')
组件内使用:
<template>
  <div class="map">
    <div class="map_chart" ref="map_chart"></div>
  </div>
</template>

<script>
import axios from "axios";
export default {
  name: "Map",
  data() {
    return {
      chartInstance: null,
      allData: null,
      mapData: {}, // 所获取的省份的地图矢量数据
      colorArr: ['#4ab2e5', "#4fb6d2", "#52b9c7", "#5abead", "#f56321", "#f34e2b", "#f56f1c", "#f56f1c", "#f58414", "#c1bb1f", "#f5a305", "#b9be23"],
    };
  },
  created() { },
  mounted() {
    this.initChart();
    window.addEventListener("resize", this.screenAdapter);
    this.screenAdapter();
  },
  destroyed() {
    window.removeEventListener("resize", this.screenAdapter);
  },
  methods: {
    async initChart() {
      this.chartInstance = this.$echarts.init(this.$refs.map_chart);
      // 获取中国地图的矢量数据
      // http://localhost:8999/static/map/china.json
      // 由于我们现在获取的地图矢量数据并不是位于KOA2的后台, 所以咱们不能使用this.$http
      const ret = await axios.get("http://localhost:5173/static/map.json");
      console.log(ret, "22");
      this.$echarts.registerMap("shouguang", ret.data);
      const initOption = {
        // title: {
        //   text: "▎ 公墓分布",
        //   left: 20,
        //   top: 20,
        // },
        geo: {
          type: "map",
          map: "shouguang",
          top: "5%",
          bottom: "5%",
          label: {
            show: true,
            color: "#1DE9B6",
          },
          itemStyle: {
            areaColor: {
              type: "radial",
              x: 0.5,
              y: 0.5,
              r: 0.8,
              colorStops: [
                {
                  offset: 0,
                  color: "#09132c", // 0% 处的颜色
                },
                {
                  offset: 1,
                  color: "#274d68", // 100% 处的颜色
                },
              ],
              globalCoord: true, // 缺省为 false
            },
            shadowColor: "rgb(58,115,192)",
            shadowOffsetX: 1,
            shadowOffsetY: 1,
          },
          emphasis: {
            itemStyle: {
              areaColor: "rgb(46,229,206)",
              shadowColor: "rgb(12,25,50)",
              borderWidth: 0,
            },

            label: {
              show: true,
              color: "#fff",
            },
          },
        },
        legend: {
          left: "5%",
          bottom: "5%",
          orient: "vertical",
        },
        series: [
          // {
          //    type: 'map',
          //     map: 'shouguang' //使用
          // },
          {
            type: 'effectScatter',
            coordinateSystem: 'geo',
            showEffectOn: 'render',
            zlevel: 1,
            rippleEffect: {
              period: 10,
              scale: 3,
              brushType: 'fill'
            },
            silent: true,
            hoverAnimation: true,
            label: {
              // normal: {
              //     formatter:function(arg){
              //      return arg.data.title
              //     },
              //     position: 'top',
              //     offset: [0, -10],
              //     color: '#fff',
              //     show: true
              // },

            },
            emphasis: {
              //  label: {
              //    show:true,
              //   color: '#fff',
              //   formatter:function(arg){
              //      return arg.data.title
              //     },
              //     position: 'top',
              //     offset: [0, -20],
              //  }

            },
            itemStyle: {
              normal: {
                color: function () { //随机颜色
                  return "#f56321"
                },
                shadowBlur: 10,
                shadowColor: '#333'
              }
            },
            tooltip: {
              show: true,
              formatter: function (arg) {
                return arg.data.title
              }
            },
            symbolSize: 12,
            data: [
              {
                title: '田柳镇',
                name: "田柳镇",
                value: [118.7712820426, 37.0142500629]
              },
              {
                title: '羊口镇',
                name: "羊口镇",
                value: [118.8566660426, 37.2021022859]
              }
            ]
          }, //地图线的动画效果
          {
            type: 'lines',
            zlevel: 2,
            effect: {
              show: true,
              period: 4, //箭头指向速度,值越小速度越快
              trailLength: 0.4, //特效尾迹长度[0,1]值越大,尾迹越长重
              symbol: 'arrow', //箭头图标
              symbolSize: 7, //图标大小
            },
            lineStyle: {
              normal: {
                color: function () { //随机颜色
                  ['#f21347', '#f3243e', '#f33736', '#f34131', '#f34e2b',
                    '#f56321', '#f56f1c', '#f58414', '#f58f0e', '#f5a305',
                    '#e7ab0b', '#dfae10', '#d5b314', '#c1bb1f', '#b9be23',
                    '#a6c62c', '#96cc34', '#89d23b', '#7ed741', '#77d64c',
                    '#71d162', '#6bcc75', '#65c78b', '#5fc2a0', '#5abead',
                    '#52b9c7', '#4fb6d2', '#4ab2e5']
                  return "#" + ("00000" + ((Math.random() * 16777215 + 0.5) >> 0).toString(16)).slice(-6);
                },
                width: 1, //线条宽度
                opacity: 0.1, //尾迹线条透明度
                curveness: .3 //尾迹线条曲直度
              }
            },
            data: [
              {
                coords: [[118.7712820426, 37.0142500629], [118.8566660426, 37.2021022859]]
              }
            ]
          }
        ]
      };
      this.chartInstance.setOption(initOption);
      this.chartInstance.on("click", async (arg) => {
        // arg.name 得到所点击的省份, 这个省份他是中文
      });
    },
    getData(ret) {
      // 获取服务器的数据, 对this.allData进行赋值之后, 调用updateChart方法更新图表
      // const { data: ret } = await this.$http.get('map')
      this.allData = ret;
      console.log(this.allData);
      this.updateChart();
    },
    updateChart() {
      // 处理图表需要的数据
      // 图例的数据
      const legendArr = this.allData.map((item) => {
        return item.name;
      });
      const seriesArr = this.allData.map((item) => {
        // return的这个对象就代表的是一个类别下的所有散点数据
        // 如果想在地图中显示散点的数据, 我们需要给散点的图表增加一个配置, coordinateSystem:geo
        return {
          type: "effectScatter",
          rippleEffect: {
            scale: 5,
            brushType: "stroke",
          },
          name: item.name,
          data: item.children,
          coordinateSystem: "geo",
        };
      });
      const dataOption = {
        legend: {
          data: legendArr,
        },
        series: seriesArr,
      };
      this.chartInstance.setOption(dataOption);
    },
    screenAdapter() {
      const titleFontSize = (this.$refs.map_chart.offsetWidth / 100) * 3.6;
      const adapterOption = {
        title: {
          textStyle: {
            fontSize: titleFontSize,
          },
        },
        legend: {
          itemWidth: titleFontSize / 2,
          itemHeight: titleFontSize / 2,
          itemGap: titleFontSize / 2,
          textStyle: {
            fontSize: titleFontSize / 2,
          },
        },
      };
      this.chartInstance.setOption(adapterOption);
      this.chartInstance.resize();
    },
  },
};
</script>
<style scoped>
.map {
  width: 100%;
  height: 100%;
  background: rgb(22, 21, 34);
  color: #fff;
}

.map_chart {
  width: 1200px;
  height: 500px;
}
</style>


 1万+
1万+

 被折叠的 条评论
为什么被折叠?
被折叠的 条评论
为什么被折叠?
 到【灌水乐园】发言


