


目录
A
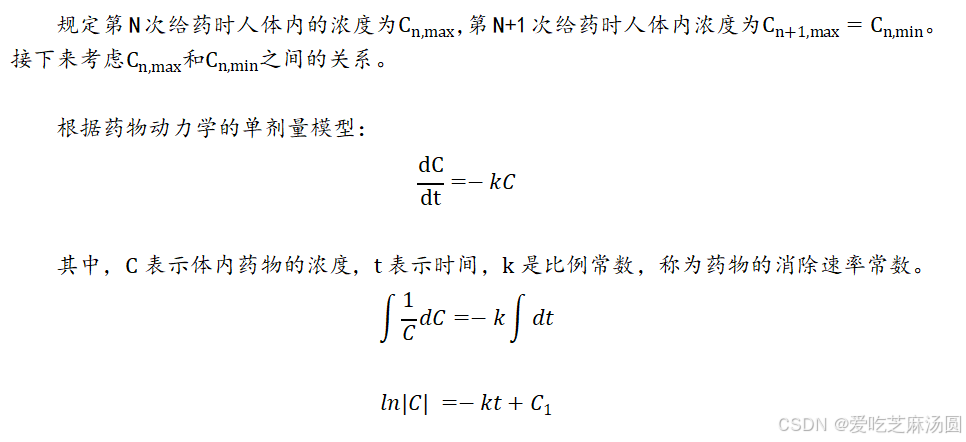
医生给病人开处方时必须注明两点:服药的剂量和服药的时间间隔.超剂量的药品会对身体产生严重不良后果,甚至死亡,而剂量不足,则不能达到治病的目的.已知患者服药后,随时间推移,药品在体内逐渐被吸收,发生生化反应,也就是体内药品的浓度逐渐降低.药品浓度降低的速率与体内当时药品的浓度成正比.当服药量为A、服药间隔为T,试分析体内药物浓度随时间的变化规律.
- 每次给药后药物浓度不回归到零,而是在体内积累或残留一部分药物。
- 设定k为药物的消除速率常数。
根据上文的算法,代码如下:
import numpy as np
import matplotlib.pyplot as plt
import matplotlib
matplotlib.use('TkAgg')

# 定义药物动力学参数
A = 0.8  # 单次给药剂量
k = 0.5  # 消除速率常数
T = 2.0  # 服药间隔时间

# 定义模拟的时间范围和步长
t_max = 24  # 最大时间(小时)
dt = 0.1  # 时间步长(小时)

# 创建时间数组
t = np.arange(0, t_max, dt)

# 初始化药物浓度数组
C = np.zeros_like(t)

# 记录给药时间点
dosing_times = np.arange(0, t_max, T)

# 计算药物浓度
for n, dosing_time in enumerate(dosing_times):
    if n == 0:
        # 第一次给药
        C[:int(dosing_times[0]/dt)] = 0.0
    else:
        # 后续给药
        for i in range(n):
            index = int(n * T / dt)
            C[index:] += A * np.exp(-k * (t[index:] - dosing_times[i]))

# 绘制药物浓度随时间变化的曲线
plt.plot(t, C, label='Drug Concentration')
plt.xlabel('Time (hours)')
plt.ylabel('Drug Concentration')
plt.title('Drug Concentration Over Time with Multiple Dosing')
plt.legend()
plt.show()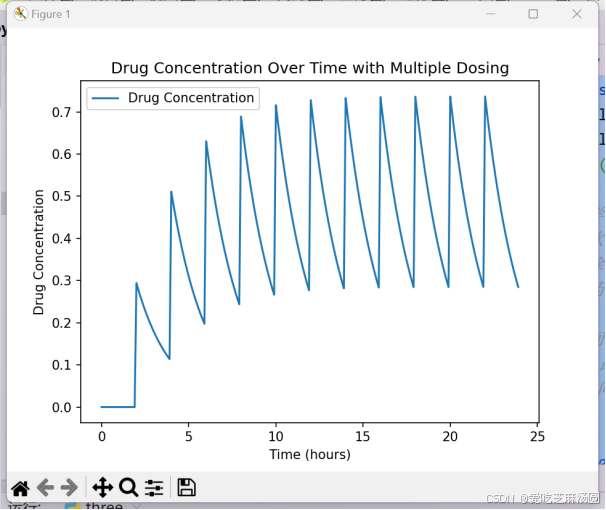
图1 计算机模拟结果
可以看出,最后药物浓度趋近平衡。
附录:
- 计算机模拟药物浓度变化:
import numpy as np
import matplotlib.pyplot as plt
import matplotlib
matplotlib.use('TkAgg')

# 定义药物动力学参数
A = 0.8  # 单次给药剂量
k = 0.5  # 消除速率常数
T = 2.0  # 服药间隔时间

# 定义模拟的时间范围和步长
t_max = 24  # 最大时间(小时)
dt = 0.1  # 时间步长(小时)

# 创建时间数组
t = np.arange(0, t_max, dt)

# 初始化药物浓度数组
C = np.zeros_like(t)

# 记录给药时间点
dosing_times = np.arange(0, t_max, T)

# 计算药物浓度
for n, dosing_time in enumerate(dosing_times):
    if n == 0:
        # 第一次给药
        C[:int(dosing_times[0]/dt)] = 0.0
    else:
        # 后续给药
        for i in range(n):
            index = int(n * T / dt)
            C[index:] += A * np.exp(-k * (t[index:] - dosing_times[i]))

# 绘制药物浓度随时间变化的曲线
plt.plot(t, C, label='Drug Concentration')
plt.xlabel('Time (hours)')
plt.ylabel('Drug Concentration')
plt.title('Drug Concentration Over Time with Multiple Dosing')
plt.legend()
plt.show()


 595
595

 被折叠的 条评论
为什么被折叠?
被折叠的 条评论
为什么被折叠?
 到【灌水乐园】发言


