


一、首先要达到X轴按月份等间距的较好效果,需要说明几点:
1、作为X轴的数据是日期数据,如2021/4/22
2、数据是离散的,并且作为X轴的值不能过多,比如选取每个月份的几个特征日期值。
本文使用的X轴需要展示的数据如下:
xAxisData: ["2020/1/20", "2020/1/21", "2020/1/22", "2020/1/23", "2020/1/24", "2020/1/25", "2020/1/26",
            "2020/1/27", "2020/1/28", "2020/1/29", "2020/1/30", "2020/1/31", "2020/2/8", "2020/2/9", "2020/2/10",
            "2020/2/11", "2020/2/12", "2020/2/13", "2020/2/14", "2020/3/27", "2020/3/28", "2020/3/29", "2020/3/30",
            "2020/3/31", "2020/4/7", "2020/4/8", "2020/4/9", "2020/5/1", "2020/6/12", "2020/6/14", "2020/9/14",
            "2020/10/1",
        ]
3、由于月份间隔的数值不完全相等,如2月只有28天、其他还分大月31天和小月30天,因此如果要完全相等间隔是不可能的,只能达到近似等间隔效果。
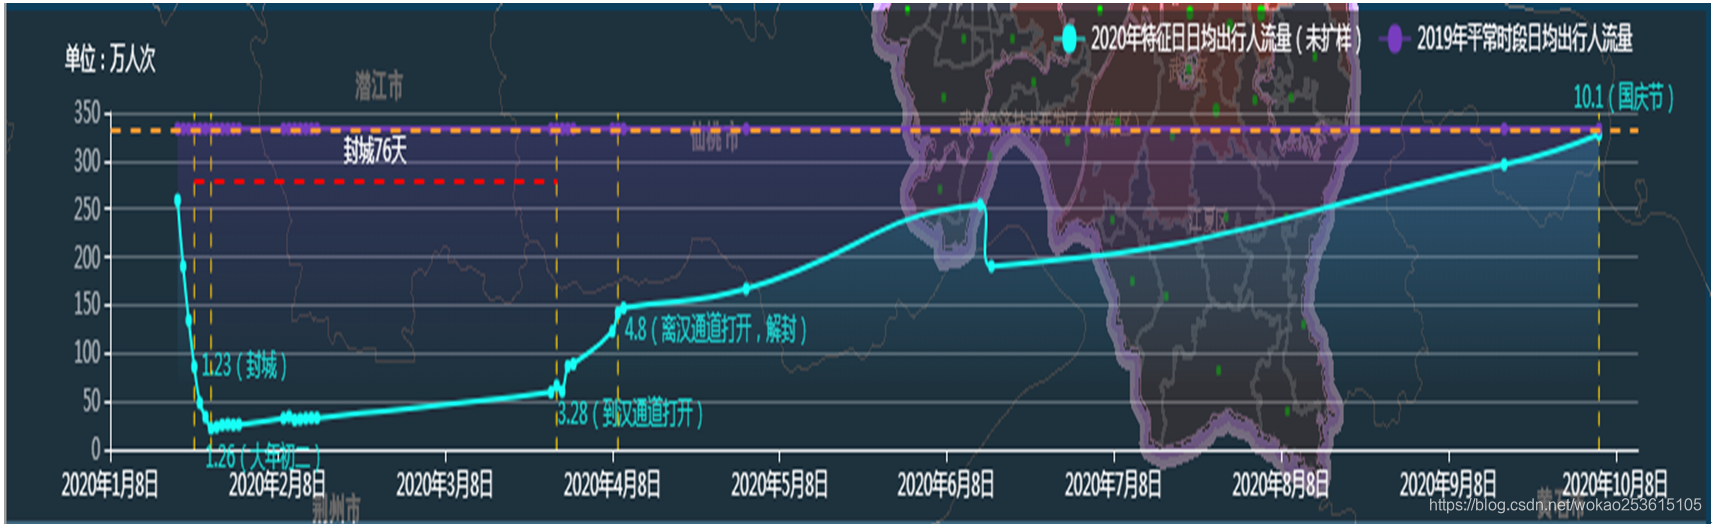
之所以用按月份等间隔,因为这样可以一目了然的关注到各个月份中的特征值变化情况。
二、示例数据如下:
cityInner:{
    LineChartData:{
        xAxisData: ["2020/1/20", "2020/1/21", "2020/1/22", "2020/1/23", "2020/1/24", "2020/1/25", "2020/1/26",
            "2020/1/27", "2020/1/28", "2020/1/29", "2020/1/30", "2020/1/31", "2020/2/8", "2020/2/9", "2020/2/10",
            "2020/2/11", "2020/2/12", "2020/2/13", "2020/2/14", "2020/3/27", "2020/3/28", "2020/3/29", "2020/3/30",
            "2020/3/31", "2020/4/7", "2020/4/8", "2020/4/9", "2020/5/1", "2020/6/12", "2020/6/14", "2020/9/14",
            "2020/10/1",
        ],
        legendData:[
            "2020年特征日日均出行人流量(未扩样)","2019年平常时段日均出行人流量"
        ],
        //数据值为了保密,value屏蔽了,自己重新设置
        data:[
            [
                ["2020/1/20",0],["2020/1/21",0],["2020/1/22",0],["2020/1/23",0],["2020/1/24",0],["2020/1/25",0],["2020/1/26",0],
                ["2020/1/27",0],["2020/1/28",0],["2020/1/29",0],["2020/1/30",0],["2020/1/31",0],["2020/2/8",0],["2020/2/9",0],["2020/2/10",0],
                ["2020/2/11",0],["2020/2/12",0],["2020/2/13",0],["2020/2/14",0],["2020/3/27",0],["2020/3/28",0],["2020/3/29",0],["2020/3/30",0],
                ["2020/3/31",0], ["2020/4/7",0],["2020/4/8",0],["2020/4/9",0],["2020/5/1",0],["2020/6/12",0],["2020/6/14",0],["2020/9/14",0],
                ["2020/10/1",0],
            ],
            [
                ["2020/1/20",0],["2020/1/21",0],["2020/1/22",0],["2020/1/23",0],["2020/1/24",0],["2020/1/25",0],["2020/1/26",0],
                ["2020/1/27",0],["2020/1/28",0],["2020/1/29",0],["2020/1/30",0],["2020/1/31",0],["2020/2/8",0],["2020/2/9",0],["2020/2/10",0],
                ["2020/2/11",0],["2020/2/12",0],["2020/2/13",0],["2020/2/14",0],["2020/3/27",0],["2020/3/28",0],["2020/3/29",0],["2020/3/30",0],
                ["2020/3/31",0],["2020/4/7",0],["2020/4/8",0],["2020/4/9",0],["2020/5/1",0],["2020/6/12",0],["2020/6/14",0],["2020/9/14",0],
                ["2020/10/1",0]
            ]
        ],
        //纵向特殊标记线
        VMarkLineData:[
            [{
                xAxis: "2020/1/23",
            },{
                name: "1.23(封城)",
                xAxis: "2020/1/23",
                itemStyle: {
                    borderColor: '#facc00',
                    borderType: 'dashed',
                    borderWidth: 1,
                    opacity:0.8
                },
                label:{
                    show:true,
                    position: ['100%', (1-86/350)*100+'%'],
                    formatter: "{b}",
                    offset:[5,-7],
                }
            }],
            [{
                name: "1.26(大年初二)",
                xAxis: "2020/1/26",
                itemStyle: {
                    borderColor: '#facc00',
                    borderType: 'dashed',
                    borderWidth: 1,
                    opacity:0.8
                },
                label:{
                    show:true,
                    position: ['100%', (1-21.9/350)*100+'%'],
                    formatter: "{b}",
                    offset:[-5,5],
                }
            },{
                xAxis: "2020/1/26",
            }
            ],

           [{
                name: "3.28(到汉通道打开)",
                xAxis: "2020/3/28",
               itemStyle: {
                   borderColor: '#facc00',
                   borderType: 'dashed',
                   borderWidth: 1,
                   opacity:0.8
               },
               label:{
                   show:true,
                   position: ['100%', (1-66.4/350)*100+'%'],
                   formatter: "{b}",
                   offset:[0,5],
               }
            },{
               xAxis: "2020/3/28",
           }
            ],
            [{
                name: "4.8(离汉通道打开,解封)",
                xAxis: "2020/4/8",
                itemStyle: {
                    borderColor: '#facc00',
                    borderType: 'dashed',
                    borderWidth: 1,
                    opacity:0.8
                },
                label:{
                    show:true,
                    position: ['100%', (1-142/350)*100+'%'],
                    formatter: "{b}",
                    offset:[5,0],
                }
            },{
                xAxis: "2020/4/8",
            }
            ],
            [{
                name: "10.1(国庆节)",
                xAxis: "2020/10/1",
                itemStyle: {
                    borderColor: '#facc00',
                    borderType: 'dashed',
                    borderWidth: 1,
                    opacity:0.8
                },
                label:{
                    show:true,
                    position: [-20, (1-327.4/350)*100+'%'],
                    formatter: "{b}",
                    offset:[0,-20],
                }
            },{
                xAxis: "2020/10/1",
            }
            ],
        ],
        HMarkLineData:[
            {
            // name: "2019年平常时段日均出行人流量",
            yAxis: 333,
            lineStyle: {
                color: "#f89933"
            }
        },[
                {
                    name: "封城76天",
                    yAxis: 280,
                    xAxis:"2020/1/23",
                    lineStyle: {
                        color: "red"
                    }
                },
                {
                    yAxis: 280,
                    xAxis:"2020/3/28",
                    lineStyle: {
                        color: "red"
                    }
                }
            ]
        ]
    },
    TimeLineData:[
        {key:"20170612",year:"2017",date:"06/12",title:"2017平常时段"},
        {key:"20170617",year:"2017",date:"06/17",title:"2017平常时段"},
        {key:"20190614",year:"2019",date:"06/14",title:"2019平常时段"},
        {key:"20190616",year:"2019",date:"06/16",title:"2019平常时段"},
        {key:"20200120",year:"2020",date:"01/20",title:"武汉封城前"},
        {key:"20200123",year:"2020",date:"01/23",title:"武汉启动封城,医疗队、物资进汉"},
        {key:"20200211",year:"2020",date:"02/11",title:"封城后中"},
        {key:"20200328",year:"2020",date:"03/28",title:"到汉通道打开"},
        {key:"20200408",year:"2020",date:"04/08",title:"离汉通道打开"},
        {key:"20200501",year:"2020",date:"05/01",title:"劳动节"},
        {key:"20200612",year:"2020",date:"06/12",title:"陆续复工复产"},
        {key:"20200614",year:"2020",date:"06/14",title:""},
        {key:"20200914",year:"2020",date:"09/14",title:"大学陆续开学"},
        {key:"20201001",year:"2020",date:"10/01",title:"国庆中秋节"},

    ]
}
三、Echarts实现代码
等间距的实现,主要是通过 type选择time类型,并且设置分割数目及分割间隔
splitNumber: 10,
interval:3600 * 24 * 1000*30,//各月度有28、30、31天不等,无法完全均等
type: 'time',
纵标记线使用:markArea
横标记线使用:markLine
function(data,chartId,width,height){
        var chartobj = document.getElementById(chartId)
        if(width&&height){
            $(chartobj).css('width',width).css('height',height);
        }
        var myChart = echarts.init(chartobj);
        myChart.resize();
        if(data==null){
            myChart.clear()
            return;
        }
        var charts = {
            unit: '单位:万人次',
            names: data.legendData,
            lineX: data.xAxisData,
            value: data.data,
            VMarkLineData:data.VMarkLineData,
            HMarkLineData:data.HMarkLineData,

        }
        var color = ['rgba(23, 255,243','rgba(119,61,190','rgba(248,153,51']
        var lineY = []
        for (var i = 0; i < charts.names.length; i++) {
            var x = i
            if (x > color.length - 1) {
                x = color.length - 1
            }
            var data = {
                name: charts.names[i],
                type: 'line',
                color: color[x] + ',1)',
                smooth: true,
                areaStyle: {
                    normal: {
                        color: new echarts.graphic.LinearGradient(0, 0, 0, 1, [{
                            offset: 0,
                            color: color[x] + ', 0.3)'
                        }, {
                            offset: 0.8,
                            color: color[x] + ', 0)'
                        }], false),
                        shadowColor: 'rgba(0, 0, 0, 0.1)',
                        shadowBlur: 10
                    }
                },
                symbol: 'circle',
                symbolSize: 5,
                data: charts.value[i]
            }
            lineY.push(data)
        }
        if(charts.VMarkLineData&&charts.VMarkLineData.length>0){
            lineY[0].markArea={
                symbol: 'none',
                silent: true,
                itemStyle: {
                    normal: {
                        borderWidth: 1,
                        lineStyle: {
                            type: 'dashed',
                            color: '#fff ',
                            width: 2,
                        },
                        label: {
                            show: true,
                            position: 'right',
                            formatter: "{b}",
                            color: '#facc00',
                            distance:[0,0]
                        },
                    },
                },
                data: charts.VMarkLineData,
            }
        }
        if(charts.HMarkLineData&&charts.HMarkLineData.length>0){
            lineY[1].markLine= {
                lineStyle: {
                    width: 2
                },
                label: {
                    position: "middle",
                    formatter: "{b}",
                    color: "#fff"
                },
                symbolSize: 0,
                data: charts.HMarkLineData,
            }
        }

        var option = {
            backgroundColor:'rgba(0,0,0,0.5)',
            tooltip: {
                trigger: 'axis'
            },
            legend: {
                data: charts.names,
                textStyle: {
                    fontSize: 12,
                    color: 'rgba(255,253,255,1)'
                },
                right: '4%'
            },
            grid: {
                top: '20%',
                left: '4%',
                right: '4%',
                bottom: '4%',
                containLabel: true
            },
            xAxis: {
                splitNumber: 10,
                interval:3600 * 24 * 1000*30,//各月度有28、30、31天不等,无法完全均等
                type: 'time',
                splitLine: {
                    show:false
                },
                // boundaryGap: false,
                // data: charts.lineX,
                min: "2020/1/8",
                max: "2020/10/8",
                axisLabel: {
                    textStyle: {
                        color: 'rgba(255,255,255,1)'
                    },
                    interale: 0,
                    rotate: 0,
                    formatter: function (value,index) {//在这里写你需要的时间格式
                        var t_date = new Date(value);
                        var text=[t_date.getFullYear(),t_date.getMonth() + 1,t_date.getDate()].join('/');
                        if(text=="2020/1/8"||text=="2020/2/8"||text=="2020/3/8"||text=="2020/4/8"||text=="2020/5/8"
                            ||text=="2020/6/8"||text=="2020/7/8"||text=="2020/8/8"||text=="2020/9/8"||text=="2020/10/8"){

                            return t_date.getFullYear()+"年"+(t_date.getMonth() + 1)+"月"+ t_date.getDate()+"日"
                        }else{
                            //强制改x轴名称(间隔需先设置为28左右
                            if(t_date.getMonth() + 1==1){
                                return "2020年1月8日"
                            }
                            else  if(t_date.getMonth() + 1==2){
                                return "2020年2月8日"
                            }
                            else  if(t_date.getMonth() + 1==3){
                                return "2020年3月8日"
                            }
                            else  if(t_date.getMonth() + 1==4){
                                return "2020年4月8日"
                            }
                            else  if(t_date.getMonth() + 1==5){
                                return "2020年5月8日"
                            }
                            else  if(t_date.getMonth() + 1==6){
                                return "2020年6月8日"
                            }
                            else  if(t_date.getMonth() + 1==7){
                                return "2020年7月8日"
                            }
                            else  if(t_date.getMonth() + 1==8){
                                return "2020年8月8日"
                            }
                            else  if(t_date.getMonth() + 1==9){
                                return "2020年9月8日"
                            }
                            else  if(t_date.getMonth() + 1==10){
                                return "2020年10月8日"
                            }
                        }
                    }
                },
                axisLine: {
                    lineStyle: {
                        color: 'rgba(255,255,255,1)'
                    }
                }
            },
            yAxis: {
                name: charts.unit,
                type: 'value',
                axisLabel: {
                    formatter: '{value}',
                    textStyle: {
                        color: 'rgba(255,253,255,0.6)'
                    }
                },
                splitLine: {
                    lineStyle: {
                        color: 'rgba(255,255,255,0.3)'
                    }
                },
                axisLine: {
                    lineStyle: {
                        color: 'rgba(255,255,255,1)'
                    }
                }
            },
            series: lineY
        }
        myChart.setOption(option, true);

    }
四 结果展示


 被折叠的 条评论
为什么被折叠?
被折叠的 条评论
为什么被折叠?
 到【灌水乐园】发言


