Vue2 Echarts刷新页面图形会消失

文章讲述了在Vue项目中使用Echarts图表时遇到的问题,即数据从后台获取导致图表在页面刷新时消失。作者通过将图表配置封装为方法,在Vue的mounted生命周期中初始化图表,并使用watch监听数据变化,确保数据更新时重新配置并渲染图表,从而解决了该问题。

摘要生成于 C知道 ,由 DeepSeek-R1 满血版支持, 前往体验 >

如果data是写死的数据,刷新页面是不会出现图形消失的问题;

之所以图形消失,是因为数据来自后台服务器。

我个人在做项目的时候,这个Echarts表是单独封装了一个组件,后在vue页面引入。

在vue页面的mounted生命周期dispatch对应的action,

在组件内部借用mapState辅助函数获取vuex仓库state内存储的数据。

1、将图表配置定义为一个方法

2、mounted生命周期调用图表配置的方法

3、watch监视随意的一个数据(immediate、deep),当数据更新,再次调用图表配置的方法

1、将图表配置定义为一个方法

  methods: {
    getPsgTimeOption() {
      this.psgTimeOption = {
        tooltip: {
          formatter: '{b}:-----{c}%',
          trigger: 'axis',
          axisPointer: {
            type: 'cross',
            label: {
              backgroundColor: '#6a7985'
            }
          }
        },
        legend: {
          left: 'center',
          bottom: 'bottom',
          // 图例单选
          selectedMode: "single",
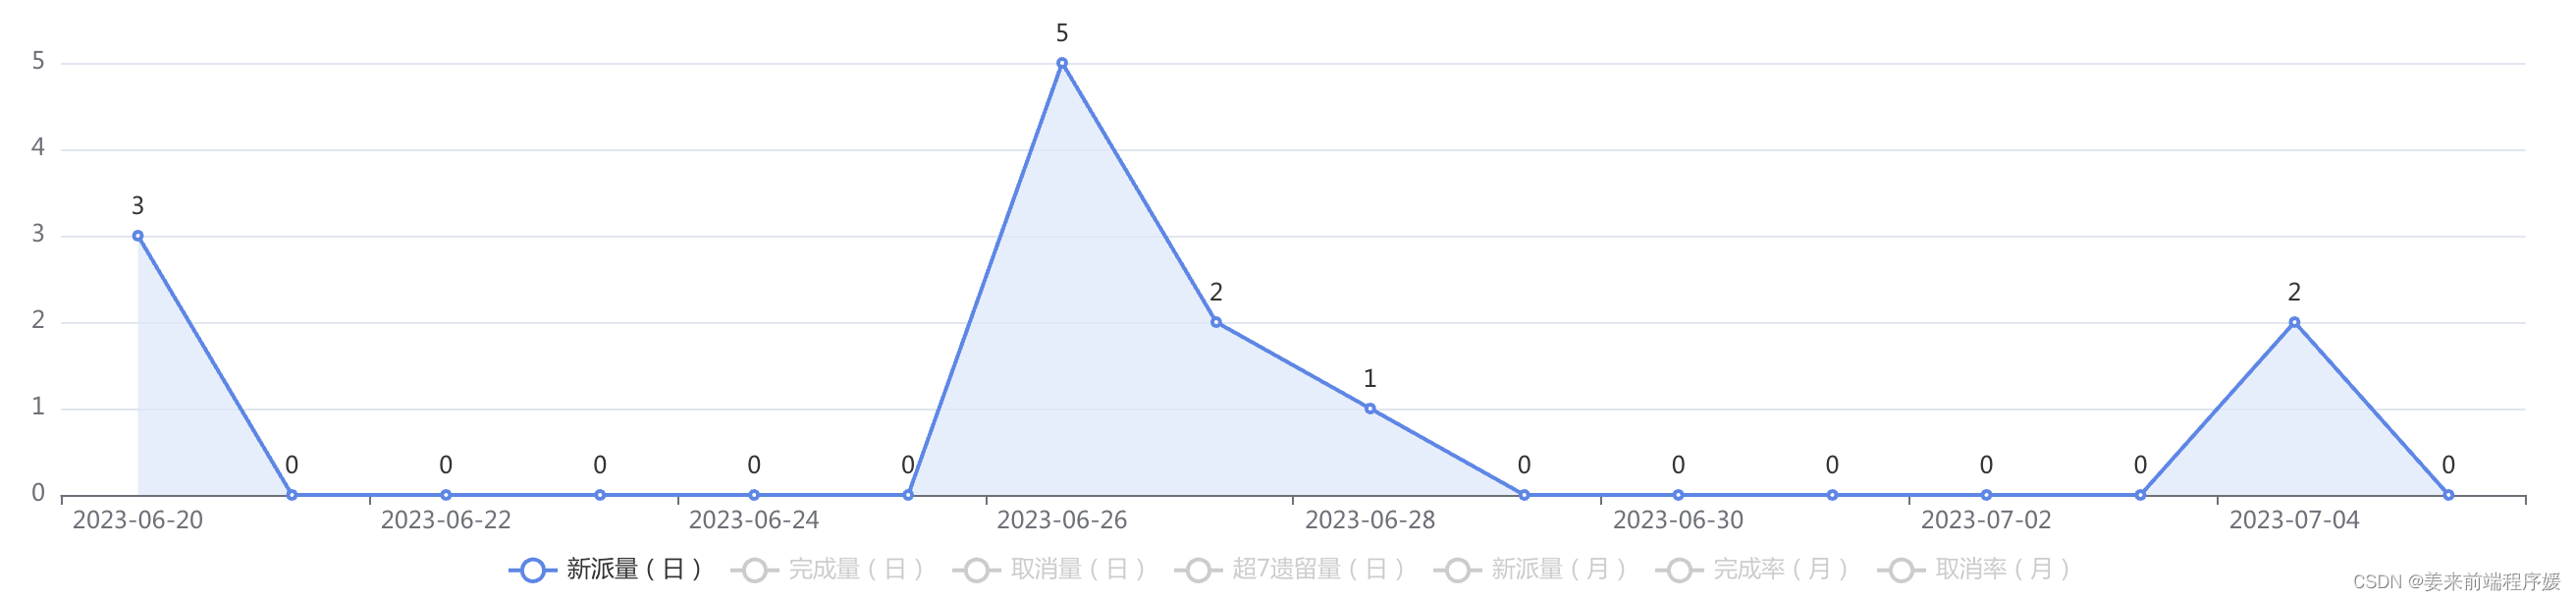
          data: ['新派量(日)', '完成量(日)', '取消量(日)', '超7遗留量(日)', '新派量(月)', '完成率(月)', '取消率(月)']
        },
        grid: {
          left: "3%",
          right: "4%",
          bottom: "10%",
          top: "10%",
          containLabel: true,
        },
        xAxis: [
          {
            type: "category",
            data: this.byDayArrx,
          }
        ],
        yAxis: [
          {
            type: "value",

            // axisLabel: { formatter: '{value} %' }
          },
        ],
        series: [
          {
            name: '新派量(日)',
            type: 'line',
            stack: 'Total',
            areaStyle: {
              color: "#dce7fc",
            },
            lineStyle: {
              color: "#5087ec",
            },
            itemStyle: {
              color: "#5087ec",
            },
            labelLine: {
              show: false,
            },
            label: {
              show: true,
              position: "top",
            },
            emphasis: {
              focus: 'series'
            },
            data: this.byDayArry
          },
          {
            name: '完成量(日)',
            type: 'line',
            stack: 'Total',
            areaStyle: {
              color: "#e0f0f6",
            },
            lineStyle: {
              color: "#85d0dc",
            },
            itemStyle: {
              color: "#85d0dc",
            },
            label: {
              show: true,
              position: "top",
            },
            data: this.comByDayArry
          },
          {
            name: '取消量(日)',
            type: 'line',
            stack: 'Total',
            areaStyle: {
              color: "#dcece3",
            },
            lineStyle: {
              color: "#62b668",
            },
            itemStyle: {
              color: "#62b668",
            },
            label: {
              show: true,
              position: "top",
            },
            data: this.cancelByDayArry
          },
          {
            name: '超7遗留量(日)',
            type: 'line',
            stack: 'Total',
            areaStyle: {
              color: "#f6f0de",
            },
            lineStyle: {
              color: "#f6d269",
            },
            itemStyle: {
              color: "#f6d269",
            },
            label: {
              show: true,
              position: "top",
            },
            data: this.timeoutByDayArry
          },
          {
            name: '新派量(月)',
            type: 'line',
            stack: 'Total',
            areaStyle: {
              color: "#fce3d5",
            },
            lineStyle: {
              color: "#ee752f",
            },
            itemStyle: {
              color: "#ee752f",
            },
            label: {
              show: true,
              position: "top",
            },
            data: this.newOrderByMonthArry
          },
          {
            name: '完成率(月)',
            type: 'line',
            stack: 'Total',
            areaStyle: {
              color: "#f4dede",
            },
            lineStyle: {
              color: "#ee5846",
            },
            itemStyle: {
              color: "#ee5846",
            },
            label: {
              show: true,
              position: "top",
              formatter: "{c}%",
            },
            data: this.comRateByMonthArry
          },
          {
            name: '取消率(月)',
            type: 'line',
            stack: 'Total',
            areaStyle: {
              color: "#dce7fc",
            },
            lineStyle: {
              color: "#5087ec",
            },
            itemStyle: {
              color: "#5087ec",
            },
            label: {
              show: true,
              position: "top",
              formatter: "{c}%",
            },
            data: this.cancelRateByMonthArry
          }
        ]
      };
      // 传递一个dom元素
      this.psgTimeCharts = echarts.init(this.$refs.psgTime)
      //传入一个配置项
      this.psgTimeCharts.setOption(this.psgTimeOption)
    }
  },

2、mounted生命周期调用图表配置的方法

  mounted() {
    this.getPsgTimeOption()
  },

3、watch监视随意的一个数据(immediate、deep),当数据更新,再次调用图表配置的方法

  watch: {
    cancelRateByMonthObj: {
      handler(nval) {
        if (nval) {
          this.getPsgTimeOption()
        }
      },
      immediate: true,
      deep: true
    }
  }
### 实现 Vue2ECharts 饼图点击区块放大 为了实现在 Vue2ECharts 组合下,当用户点击饼图中的某个扇区时该扇区能够被放大的效果,可以采用动态更新 `series` 的配置项的方法。具体来说: 通过监听用户的点击事件并调整所选区域的数据属性来达到视觉上的放大效果[^1]。 下面展示如何编写相应的 JavaScript 代码片段以完成此功能: ```javascript // main.js import Vue from 'vue'; import Echarts from './plugins/echarts'; Vue.use(Echarts); new Vue({ el: '#app', data() { return { chartInstance: null, option: { series: [{ type: 'pie', radius: ['40%', '70%'], selectedMode: 'single', // 设置单个扇形可选中状态 itemStyle: {}, emphasis: { // 定义高亮样式 scale: true, // 是否开启缩放动画,默认关闭 focus: 'self' // 当鼠标悬停时只突出当前图形元素本身 }, data: [ {value: 335, name: '直接访问'}, {value: 310, name: '邮件营销'}, {value: 234, name: '联盟广告'} ] }] } }; }, mounted() { this.initChart(); }, methods: { initChart() { const myChart = this.$refs.chart; this.chartInstance = this.$echarts.getInstanceByDom(myChart); if (!this.chartInstance) { this.chartInstance = this.$echarts.init(myChart); } let that = this; function clickHandler(params) { console.log('click:', params.name); var dataIndex = params.dataIndex; that.option.series[0].data[dataIndex]['selected'] = !that.option.series[0].data[dataIndex]['selected']; that.chartInstance.setOption(that.option); }; this.chartInstance.on('click', clickHandler.bind(this)); this.chartInstance.setOption(this.option); } } }); ``` 在此示例中,每当用户点击饼图的一个部分时,都会触发回调函数 `clickHandler()` ,这个函数会切换对应数据项的选择状态 (`selected`) 并重新设置选项从而刷新图表显示。
评论 1
添加红包

请填写红包祝福语或标题

红包个数最小为10个

红包金额最低5元

当前余额3.43前往充值 >
需支付:10.00
成就一亿技术人!
领取后你会自动成为博主和红包主的粉丝 规则
hope_wisdom
发出的红包
实付
使用余额支付
点击重新获取
扫码支付
钱包余额 0

抵扣说明:

1.余额是钱包充值的虚拟货币,按照1:1的比例进行支付金额的抵扣。
2.余额无法直接购买下载,可以购买VIP、付费专栏及课程。

余额充值