


前段时间一些朋友讨论一个PG性能的问题,他们最近把几个小的PG数据库整合为一个大系统,换了台新服务器,搞了超豪华配置,有512GB的物理内存。他们配置了一个128GB的SHARED_BUFFERS,然后应用就出问题了。因为这套系统中经常要用到临时表,而且他们的临时表都是物理表,一般是create/insert/select/drop,一串操作。系统升级后,系统就变得特别慢了,经过分析,发现主要问题出在drop table上。在一顿乱试后,他们恢复了shared_buffers原来的配置后,系统性能居然恢复了!
shared_buffers 参数的大小会直接影响到 DROP/TRUNCATE 的性能,这以前还没注意过,那来也验证了一下:
DROP测试
先介绍一下这个测试用例。这个测试用例分为run_drop.sql和tps.sh两个脚本,通过pgbench工具对DROP TABLE做了一个测试。先看run_drop.sql的代码:
SET synchronous_commit TO off;
BEGIN;
CREATE TABLE x(id int);
INSERT INTO x VALUES (1);
DROP TABLE x;
COMMIT;
关闭同步提交的目的是为了尽可能降低IO性能对测试的影响。然后执行一个建表,写数据,删除表这个操作。tps_drop.sh的代码如下:
#!/bin/sh
DB=postgres
for x in '64 MB' '128 MB' '1 GB' '2 GB' '4 GB'
do
pg_ctl -D /home/postgres/16data -l /dev/null -o "--shared_buffers='$x'" start
sleep 1
echo tps for $x
psql -c "SHOW shared_buffers" $DB
pgbench --file=run_drop.sql -j 1 -c 1 -T 10 2> /dev/null
pg_ctl -D /home/postgres/16data sto
sleep 1
done
根据不同的测试环境,需要对tps.sh做一些修改,比如psql和pgbench的参数。我做了一些调整。测试了一下。
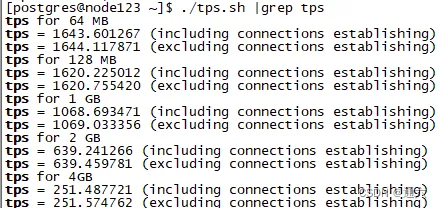
可以看出,随着shared_buffers的加大,TPS出现了明显的下降,最后居然降到了不足300。在本次测试中,系统中有足够的物理内存,确保系统不会出现SWAP的情况。在这种情况下,还是出现了此类情况,这是什么原因呢?
TRUNCATE测试:
run_truncate.sql的代码:
SET synchronous_commit TO off;
BEGIN;
CREATE TABLE if not exists x(id int);
INSERT INTO x VALUES (1);
truncate TABLE x;
COMMIT;
tps_truncate.sh的代码:
#!/bin/sh
DB=postgres
for x in '8 MB' '32 MB' '128 MB' '1 GB' '8 GB'
do
pg_ctl -D /home/postgres/16data -l /dev/null -o "--shared_buffers='$x'" start
sleep 1
echo tps for $x
psql -c "SHOW shared_buffers" $DB
pgbench --file=run_truncate.sql -j 1 -c 1 -T 10 -P 2 $DB 2> /dev/null
pg_ctl -D /home/postgres/16data stop
sleep 1
done
以下是truncate测试结果:
[postgres@postgres ~]$ ./tps_truncate.sh | grep tps
tps for 8 MB
tps = 950.839041 (without initial connection time)
tps for 32 MB
tps = 945.427848 (without initial connection time)
tps for 128 MB
tps = 928.624541 (without initial connection time)
tps for 1 GB
tps = 541.861555 (without initial connection time)
可以看到,当 shared_buffers 来到 1GB 的时候,TPS 直接衰减了一半。为什么 shared_buffers 越大,truncate性能越慢?这个和我们常规认知完全背道而驰,shared_buffers 越大,能够缓存的对象就越多,避免额外 IO 进而提升性能。
问题一般不会出在其他地方,这两个测试是单独进行的,也没有其他会话干扰,也不会有锁的问题。唯一出问题的地方是在shared_buffers上了。当drop table完成后,需要做一个类似checkpoint的工作,把shared_buffers中和这个表相关的所有buffer全部清理掉。正是这个工作拖慢了drop/truncate table的性能。
其实不难理解,当我们要删除对象时,要确保 shared_buffers 里面和这个对象相关的 buffer 都被清空,那么慢的原因,基本上就是遍历 shared_buffers 导致的了,越大,遍历当然就越慢了。那让我们深入代码细节,是否是这样。
深入分析
以 16 的代码为例,TRUNCATE 的逻辑很好找,DropRelationsAllBuffers,整体的代码逻辑较长,让我们一步一步分析。注释很明了,从 Buffer pool 中移除指定表的所有分支文件。
/* ---------------------------------------------------------------------
* DropRelationsAllBuffers
*
* This function removes from the buffer pool all the pages of all
* forks of the specified relations. It's equivalent to calling
* DropRelationBuffers once per fork per relation with firstDelBlock = 0.
* --------------------------------------------------------------------
*/
首先代码中会判断是否是本地对象,即是否是临时表
/* If it's a local relation, it's localbuf.c's problem. */
for (i = 0; i < nlocators; i++)
{
if (RelFileLocatorBackendIsTemp(smgr_reln[i]->smgr_rlocator))
{
if (smgr_reln[i]->smgr_rlocator.backend == MyBackendId)
DropRelationAllLocalBuffers(smgr_reln[i]->smgr_rlocator.locator);
}
else
rels[n++] = smgr_reln[i];
}
/*
* If there are no non-local relations, then we're done. Release the
* memory and return.
*/
if (n == 0)
{
pfree(rels);
return;
}
然后分配一个二维数组,记录要 DROP/TRUNCATE 对象的所有数据块。
/*
* This is used to remember the number of blocks for all the relations
* forks.
*/
block = (BlockNumber (*)[MAX_FORKNUM + 1])
palloc(sizeof(BlockNumber) * n * (MAX_FORKNUM + 1));
接下来是代码核心流程,先看注释:
We can avoid scanning the entire buffer pool if we know the exact size of each of the given relation forks. See DropRelationBuffers.
如果我们知道每个给定关系分支的确切大小,我们可以避免扫描整个缓冲池。请参阅 DropRelationBuffers。
/*
* We can avoid scanning the entire buffer pool if we know the exact size
* of each of the given relation forks. See DropRelationBuffers.
*/
for (i = 0; i < n && cached; i++)
{
for (int j = 0; j <= MAX_FORKNUM; j++)
{
/* Get the number of blocks for a relation's fork. */
block[i][j] = smgrnblocks_cached(rels[i], j); ---返回InvalidBlockNumber
/* We need to only consider the relation forks that exists. */
if (block[i][j] == InvalidBlockNumber)
{
if (!smgrexists(rels[i], j)) ---判断文件是否存在,进而返回cached = false
continue;
cached = false;
break;
}
/* calculate the total number of blocks to be invalidated */
nBlocksToInvalidate += block[i][j];
}
}
DropRelationBuffers 中有这么一段注释,写明了原因,目前仅适用于恢复和备库!
/*
* To remove all the pages of the specified relation forks from the buffer
* pool, we need to scan the entire buffer pool but we can optimize it by
* finding the buffers from BufMapping table provided we know the exact
* size of each fork of the relation. The exact size is required to ensure
* that we don't leave any buffer for the relation being dropped as
* otherwise the background writer or checkpointer can lead to a PANIC
* error while flushing buffers corresponding to files that don't exist.
*
为了从缓冲池中移除指定关系分支的所有页面,我们需要扫描整个缓冲池,但如果我们知道关系的每个分
支的确切大小,我们可以通过从BufMapping表中查找缓冲区来优化它。需要确切大小是为了确保我们没
有留下任何要删除的关系的缓冲区,否则后台写入器或检查点器在刷新不存在的文件对应的缓冲区时可能
会导致PANIC错误。
* To know the exact size, we rely on the size cached for each fork by us
* during recovery which limits the optimization to recovery and on
* standbys but we can easily extend it once we have shared cache for
* relation size.
为了知道确切的大小,我们依赖于在恢复期间为每个分支缓存的大小,这限制了优化适用于恢复和备用节
点,但一旦我们有了关系大小的共享缓存,我们可以轻松扩展它。
*
* In recovery, we cache the value returned by the first lseek(SEEK_END)
* and the future writes keeps the cached value up-to-date. See
* smgrextend. It is possible that the value of the first lseek is smaller
* than the actual number of existing blocks in the file due to buggy
* Linux kernels that might not have accounted for the recent write. But
* that should be fine because there must not be any buffers after that
* file size.
*/
于是,smgrnblocks_cached 返回的就是 InvalidBlockNumber,进而走到了将 cached 设置为了 false。
/*
* smgrnblocks_cached() -- Get the cached number of blocks in the supplied
* relation.
*
* Returns an InvalidBlockNumber when not in recovery and when the relation
* fork size is not cached.
*/
BlockNumber
smgrnblocks_cached(SMgrRelation reln, ForkNumber forknum)
{
/*
* For now, we only use cached values in recovery due to lack of a shared
* invalidation mechanism for changes in file size.
*/
if (InRecovery && reln->smgr_cached_nblocks[forknum] != InvalidBlockNumber)
return reln->smgr_cached_nblocks[forknum];
return InvalidBlockNumber;
}
当 cached = false 时,后面的逻辑也就不会再继续走下去了,所以此处的优化仅仅针对的是备库在重放 WAL 的时候,才可以避免遍历 shared_buffers
/*
* We apply the optimization iff the total number of blocks to invalidate
* is below the BUF_DROP_FULL_SCAN_THRESHOLD.
如果要无效的页面数小于BUF_DROP_FULL_SCAN_THRESHOLD(NBuffers/32)的话,从hash中查找,否则遍历所有页面
*/
if (cached && nBlocksToInvalidate < BUF_DROP_FULL_SCAN_THRESHOLD)
{
for (i = 0; i < n; i++)
{
for (int j = 0; j <= MAX_FORKNUM; j++)
{
/* ignore relation forks that doesn't exist */
if (!BlockNumberIsValid(block[i][j]))
continue;
/* drop all the buffers for a particular relation fork */
FindAndDropRelationBuffers(rels[i]->smgr_rlocator.locator,
j, block[i][j], 0);
}
}
pfree(block);
pfree(rels);
return;
}
那么后面的逻辑就十分清晰了,判断要删除的表是否大于 RELS_BSEARCH_THRESHOLD,这个值是 20,当然也是社区开发者拍脑袋想出来的
The threshold to use is rather a guess than an exactly determined value
比如 drop test1,test2,test... ,如果要删除的表大于了 20,就采用二分查找,否则就避免进行二分查找,减少开销
/*
* For low number of relations to drop just use a simple walk through, to
* save the bsearch overhead. The threshold to use is rather a guess than
* an exactly determined value, as it depends on many factors (CPU and RAM
* speeds, amount of shared buffers etc.).
*/
use_bsearch = n > RELS_BSEARCH_THRESHOLD;
/* sort the list of rlocators if necessary */
if (use_bsearch)
pg_qsort(locators, n, sizeof(RelFileLocator), rlocator_comparator);
然后就是最为关键的地方了,NBuffers就是 shared buffers 的大小,可以看到,代码中采用了遍历!复杂度是 O(N),N = shared_buffers/8KB
for (i = 0; i < NBuffers; i++) ---最为关键的地方
{
RelFileLocator *rlocator = NULL;
BufferDesc *bufHdr = GetBufferDescriptor(i);
uint32 buf_state;
/*
* As in DropRelationBuffers, an unlocked precheck should be safe and
* saves some cycles.
*/
if (!use_bsearch)
{
int j;
for (j = 0; j < n; j++)
{
if (BufTagMatchesRelFileLocator(&bufHdr->tag, &locators[j]))
{
rlocator = &locators[j];
break;
}
}
}
else
{
RelFileLocator locator;
locator = BufTagGetRelFileLocator(&bufHdr->tag);
rlocator = bsearch((const void *) &(locator),
locators, n, sizeof(RelFileLocator),
rlocator_comparator);
}
/* buffer doesn't belong to any of the given relfilelocators; skip it */
if (rlocator == NULL)
continue;
buf_state = LockBufHdr(bufHdr);
if (BufTagMatchesRelFileLocator(&bufHdr->tag, rlocator))
InvalidateBuffer(bufHdr); /* releases spinlock */
else
UnlockBufHdr(bufHdr, buf_state);
}
pfree(locators);
pfree(rels);
所以,为什么较大的 shared_buffers 删除表会导致性能问题的原因就十分清晰了:代码中会遍历 shared_buffers,复杂度是 O(N),N = shared_buffers/8KB,所以 shared_buffers 越大,性能就越慢!
那么对于临时表是如何?让我们也简单看一下:
/*
* DropRelationAllLocalBuffers
* This function removes from the buffer pool all pages of all forks
* of the specified relation.
*
* See DropRelationsAllBuffers in bufmgr.c for more notes.
*/
void
DropRelationAllLocalBuffers(RelFileLocator rlocator)
{
int i;
for (i = 0; i < NLocBuffer; i++)
{
BufferDesc *bufHdr = GetLocalBufferDescriptor(i);
LocalBufferLookupEnt *hresult;
uint32 buf_state;
buf_state = pg_atomic_read_u32(&bufHdr->state);
if ((buf_state & BM_TAG_VALID) &&
BufTagMatchesRelFileLocator(&bufHdr->tag, &rlocator))
{
if (LocalRefCount[i] != 0)
elog(ERROR, "block %u of %s is still referenced (local %u)",
bufHdr->tag.blockNum,
relpathbackend(BufTagGetRelFileLocator(&bufHdr->tag),
MyBackendId,
BufTagGetForkNum(&bufHdr->tag)),
LocalRefCount[i]);
/* Remove entry from hashtable */
hresult = (LocalBufferLookupEnt *)
hash_search(LocalBufHash, &bufHdr->tag, HASH_REMOVE, NULL);
if (!hresult) /* shouldn't happen */
elog(ERROR, "local buffer hash table corrupted");
/* Mark buffer invalid */
ClearBufferTag(&bufHdr->tag);
buf_state &= ~BUF_FLAG_MASK;
buf_state &= ~BUF_USAGECOUNT_MASK;
pg_atomic_unlocked_write_u32(&bufHdr->state, buf_state);
}
}
}
可以看到,它的逻辑也是类似,遍历 NLocBuffer,但是 NLocBuffer 取决于 temp_buffers,temp_buffers 按照日常使用并不会特别大。
再次复现
(gdb) call smgrnblocks_cached(rels[i], j)
$1 = 4294967295
(gdb) p smgrnblocks_cached(rels[i], j)
$2 = 4294967295
(gdb) p/x smgrnblocks_cached(rels[i], j)
$3 = 0xffffffff
(gdb) p cached
$4 = false
这个 0xffffffff 便是 InvalidBlockNumber,最终返回 cached = false。
#define InvalidBlockNumber ((BlockNumber) 0xFFFFFFFF)
另外,最开始判断需要删除的对象数量,包括表所有的对象,比如 TOAST,比如 TOAST 的索引,所以各位可以验证一下,比如 create table test1(id int),那么这个 n 就是 1 ,如果 create table test2(info text),这个 n 就是 3,然后所有的对象的都要经过遍历,可想而知,表越复杂,索引越多,那么删除就越慢!
/* If it's a local relation, it's localbuf.c's problem. */
for (i = 0; i < nlocators; i++)
{
if (RelFileLocatorBackendIsTemp(smgr_reln[i]->smgr_rlocator))
{
if (smgr_reln[i]->smgr_rlocator.backend == MyBackendId)
DropRelationAllLocalBuffers(smgr_reln[i]->smgr_rlocator.locator);
}
else
rels[n++] = smgr_reln[i];
}
此处我用 until 跳出循环,最终可以看到,遍历了 16384 次!也就是整个 shared buffers 的大小。
(gdb) until
(gdb) p i
$16 = 16384
前文也提了,仅适用于备库做回放的时候,14中引入了一项优化:https://git.postgresql.org/gitweb/?p=postgresql.git;a=commit;h=d6ad34f3410f101f9909c0918a49d6ce86fa216c, 如果要删除的页面数小于 NBuffers/32 的话,从BufMapping哈希表中查找,否则遍历所有页面
DropRelFileNodeBuffers()的恢复路径经过了优化,当一个关系中要截断的块数低于某个阈值时,可以避免扫描整个缓冲池。对于这样的情况,我们通过在BufMapping表中查找来找到缓冲区。这在很多情况下(测试了1000个关系的多个小表)提高了性能,超过了100倍,特别是在服务器配置了大量共享缓冲区的情况下(大于等于100GB)。这种优化有助于以下情况:1、当vacuum或autovacuum截断了关系末尾的任何空页,或者2、当关系在创建它的同一个事务中被截断。此提交引入了一个新的API smgrnblocks_cached,它返回关系分支中块数的缓存值。这有助于我们确定应用此优化所需的关系的确切大小。需要确切的大小是为了确保我们没有留下任何要删除的关系的缓冲区,否则后台写入器或检查点器在刷新不存在的文件对应的缓冲区时可能会导致PANIC错误。
不过前文也说了,仅仅是针对主从复制的场景。
小结
所以,为什么普通表会出问题,因为 shared buffers 往往会很大,假如你将 temp_buffers 一样设置很大,照样会有性能衰减,让我们稍作修改,针对临时表测一下
#!/bin/sh
DB=postgres
for x in '8 MB' '32 MB' '128 MB' '1 GB' '8 GB'
do
pg_ctl -D /home/postgres/16data -l /dev/null -o "--temp_buffers='$x'" start
sleep 1
echo tps for $x
# psql -c "SHOW shared_buffers" $DB
psql -c "SHOW temp_buffers" $DB
pgbench --file=run_temp.sql -j 1 -c 1 -T 10 -P 2 $DB 2> /dev/null
pg_ctl -D /home/postgres/16data stop
sleep 1
done
测试结果如出一辙:
[postgres@xiongcc ~]$ ./tps_temp.sh | grep tps
tps for 8 MB
tps = 1643.377319 (without initial connection time)
tps for 32 MB
tps = 1641.946117 (without initial connection time)
tps for 128 MB
tps = 1375.333656 (without initial connection time)
tps for 1 GB
tps = 607.852753 (without initial connection time)
tps for 8 GB
tps = 96.615903 (without initial connection time)
看样子 shared_buffers 的调整真的是一门很大的学问。


 2428
2428

 被折叠的 条评论
为什么被折叠?
被折叠的 条评论
为什么被折叠?
 到【灌水乐园】发言


