1:又是老步骤啦 (安装)
npm install echarts --save


有淘宝镜像的推荐...
cnpm install echarts --save
2:创建一个js文件(命名随意)
3:js中的配置(必须配置)
// 引入 echarts 核心模块,核心模块提供了 echarts 使用必须要的接口。
import * as echarts from "echarts/core";
// 引入柱状图图表,图表后缀都为 Chart
import { BarChart, LineChart } from "echarts/charts";
// 引入提示框,标题,直角坐标系,数据集,内置数据转换器组件,组件后缀都为 Component
import {
  TitleComponent,
  TooltipComponent,
  GridComponent,
  DatasetComponent,
  TransformComponent,
  LegendComponent,
  ToolboxComponent,
} from "echarts/components";
// 标签自动布局,全局过渡动画等特性
import { LabelLayout, UniversalTransition } from "echarts/features";
// 引入 Canvas 渲染器,注意引入 CanvasRenderer 或者 SVGRenderer 是必须的一步
import { CanvasRenderer } from "echarts/renderers";

// 注册必须的组件
echarts.use([
  TitleComponent,
  TooltipComponent,
  GridComponent,
  DatasetComponent,
  TransformComponent,
  BarChart,
  LabelLayout,
  UniversalTransition,
  CanvasRenderer,
  LegendComponent,
  ToolboxComponent,
  LineChart,
]);

// 导出
export default echarts;
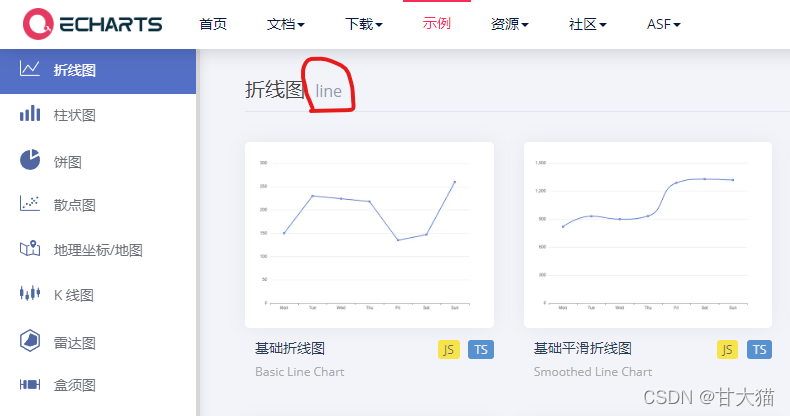
3.5:(注意)图表引入后缀都是Chart 前缀是每个图表的开头 如下图

4.0:import { LineChart } from "echarts/charts"; (开头一定要大写)
5:在全局main.js中引入这个js文件
// 引入echarts
import echarts from '@/utils/echarts.js'


// 注册到全局中 (全局实例)
app.config.globalProperties.$echarts = echarts;
6:在需要使用的页面引入
//图表展示的盒子    (注意:给盒子加宽度和高度哟 不然图表怎么显示嘞)
<div id="zoom"></div>


//操作区域
<script setup lang="ts">
//引入声明周期
import { onMounted, onUnmounted } from "vue";
/** 下面三个步骤是必须有的 */
//1:获取全局实例方法
import { getCurrentInstance } from "vue";
//2:获取注入全局的echarts
const internalInstance = getCurrentInstance();
//3:取出
const { $echarts } = internalInstance.appContext.config.globalProperties;


//页面挂载完成后设置图表实例
onMounted(() =>{

// 基于准备好的dom,初始化echarts实例
const myChart = $echarts.init(document.getElementById("zoom"));

//配置项
 const option = { ...你自己需要的图表配置 }

// 使用刚指定的配置项和数据显示图表。
  myChart.setOption(option);
})

</script>
7:效果 快去配置一下试试吧


 本文介绍了如何在Vue项目中通过npm安装ECharts,并详细展示了如何配置基本的柱状图和折线图。从引入组件、配置文件到在Vue页面中展示图表,一步步详解,适合初学者入门。


 1518
1518

 被折叠的 条评论
为什么被折叠?


