


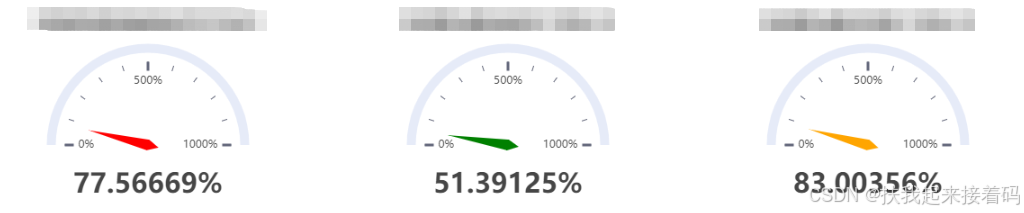
使用三个仪表盘展示数据,并且在同一行排列
import { EChartsOption ,SeriesOption} from 'echarts';
import EChartsReact from 'echarts-for-react';
1、定义仪表盘
const pancreatic: EChartsOption[] = [
{
renderer: 'svg',
title: {
text: '',
left: 'center',
},
tooltip: {},
series: [
{
name: '',
type: 'gauge',
startAngle: -180,
endAngle: 0,
max: 1000, // 最大的数值
splitNumber: 2,
axisLabel: { // 刻度标签。
show: true, // 是否显示标签,默认 true。
formatter: '{value}%', // 刻度标签的内容格式器,支持字符串模板和回调函数两种形式。 示例:// 使用字符串模板,模板变量为刻度默认标签 {value},如:formatter: '{value} kg'; // 使用函数模板,函数参数分别为刻度数值,如formatter: function (value) {return value + 'km/h';}
},
itemStyle: { // 仪表盘指针样式。
color: "red", // 指针颜色,默认(auto)取数值所在的区间的颜色
},
detail: { formatter: '{value}%' },
data: [{value:0}],
},
],
},
{
renderer: 'svg',
title: {
text: '',
left: 'center',
},
tooltip: {},
series: [
{
name: '',
type: 'gauge',
startAngle: -180,
endAngle: 0,
max: 1000, // 最大的数据值,默认 100 。映射到 maxAngle。
splitNumber: 2,
axisLabel: { // 刻度标签。
show: true, // 是否显示标签,默认 true。
formatter: '{value}%', // 刻度标签的内容格式器,支持字符串模板和回调函数两种形式。 示例:// 使用字符串模板,模板变量为刻度默认标签 {value},如:formatter: '{value} kg'; // 使用函数模板,函数参数分别为刻度数值,如formatter: function (value) {return value + 'km/h';}
},
itemStyle: { // 仪表盘指针样式。
color: "green", // 指针颜色,默认(auto)取数值所在的区间的颜色
},
detail: { formatter: '{value}%' },
data: [{value:0}],
},
],
},
{
renderer: 'svg',
title: {
text: '',
left: 'center',
},
tooltip: {},
series: [
{
name: '',
type: 'gauge',
startAngle: -180,
endAngle: 0,
max: 1000, // 最大的数据值,默认 100 。映射到 maxAngle。
splitNumber: 2,
axisLabel: { // 刻度标签。
show: true, // 是否显示标签,默认 true。
formatter: '{value}%', // 刻度标签的内容格式器,支持字符串模板和回调函数两种形式。 示例:// 使用字符串模板,模板变量为刻度默认标签 {value},如:formatter: '{value} kg'; // 使用函数模板,函数参数分别为刻度数值,如formatter: function (value) {return value + 'km/h';}
},
itemStyle: { // 仪表盘指针样式。
color: "#FFA500", // 指针颜色,默认(auto)取数值所在的区间的颜色
},
detail: { formatter: '{value}%' },
data: [{value:0}],
},
],
},
];
const [pancreaticoption,setpancreaticoption]=useState<EChartsOption[]>(pancreatic)
2、从后端获取数据
const response = await linedata(id);
const pancreaticOptions = pancreaticoption.map((opt,index) => {
const series=(opt.series as SeriesOption[])
const title=opt.title
if(index===0){
return {...opt,title:{...title,text:response.data.pancreaticInsulin.insulinAssessment.insulinBaseConclusion},series:[{...series[0], data:response.data.pancreaticInsulin.basic}]}
}
else if(index===1){
return {...opt,title:{...title,text:response.data.pancreaticInsulin.insulinAssessment.insulinPeakConclusion},series:[{...series[0], data:response.data.pancreaticInsulin.peak}]}
}
else if(index===2){
return {...opt,title:{...title,text:response.data.pancreaticInsulin.insulinAssessment.insulinSlopeConclusion},series:[{...series[0], data:response.data.pancreaticInsulin.slope}]}
}
return opt
});
setpancreaticoption(pancreaticOptions);
后端返回数据格式为:
"data": {
"pancreaticInsulin":{
"basic":[{value:60}],
"peak":[{value:100}],
"slope":[{value:200}]
},
}
3、把仪表盘渲染在页面
<div style={{ display: 'flex',height:'300px' }}>
{pancreaticoption.map((option, index) => (
<div key={index} style={{flex: 1, margin: '20px 10px' }}>
<EChartsReact option={option} />
</div>
))}
</div>


 505
505

 被折叠的 条评论
为什么被折叠?
被折叠的 条评论
为什么被折叠?
 到【灌水乐园】发言


