


 本文讲述了作者在调试过程中发现HTML空白问题并非环境配置问题,而是代码错误。提供了一个使用ECharts绘制图表的正确代码示例,包括JavaScript配置和HTML结构。
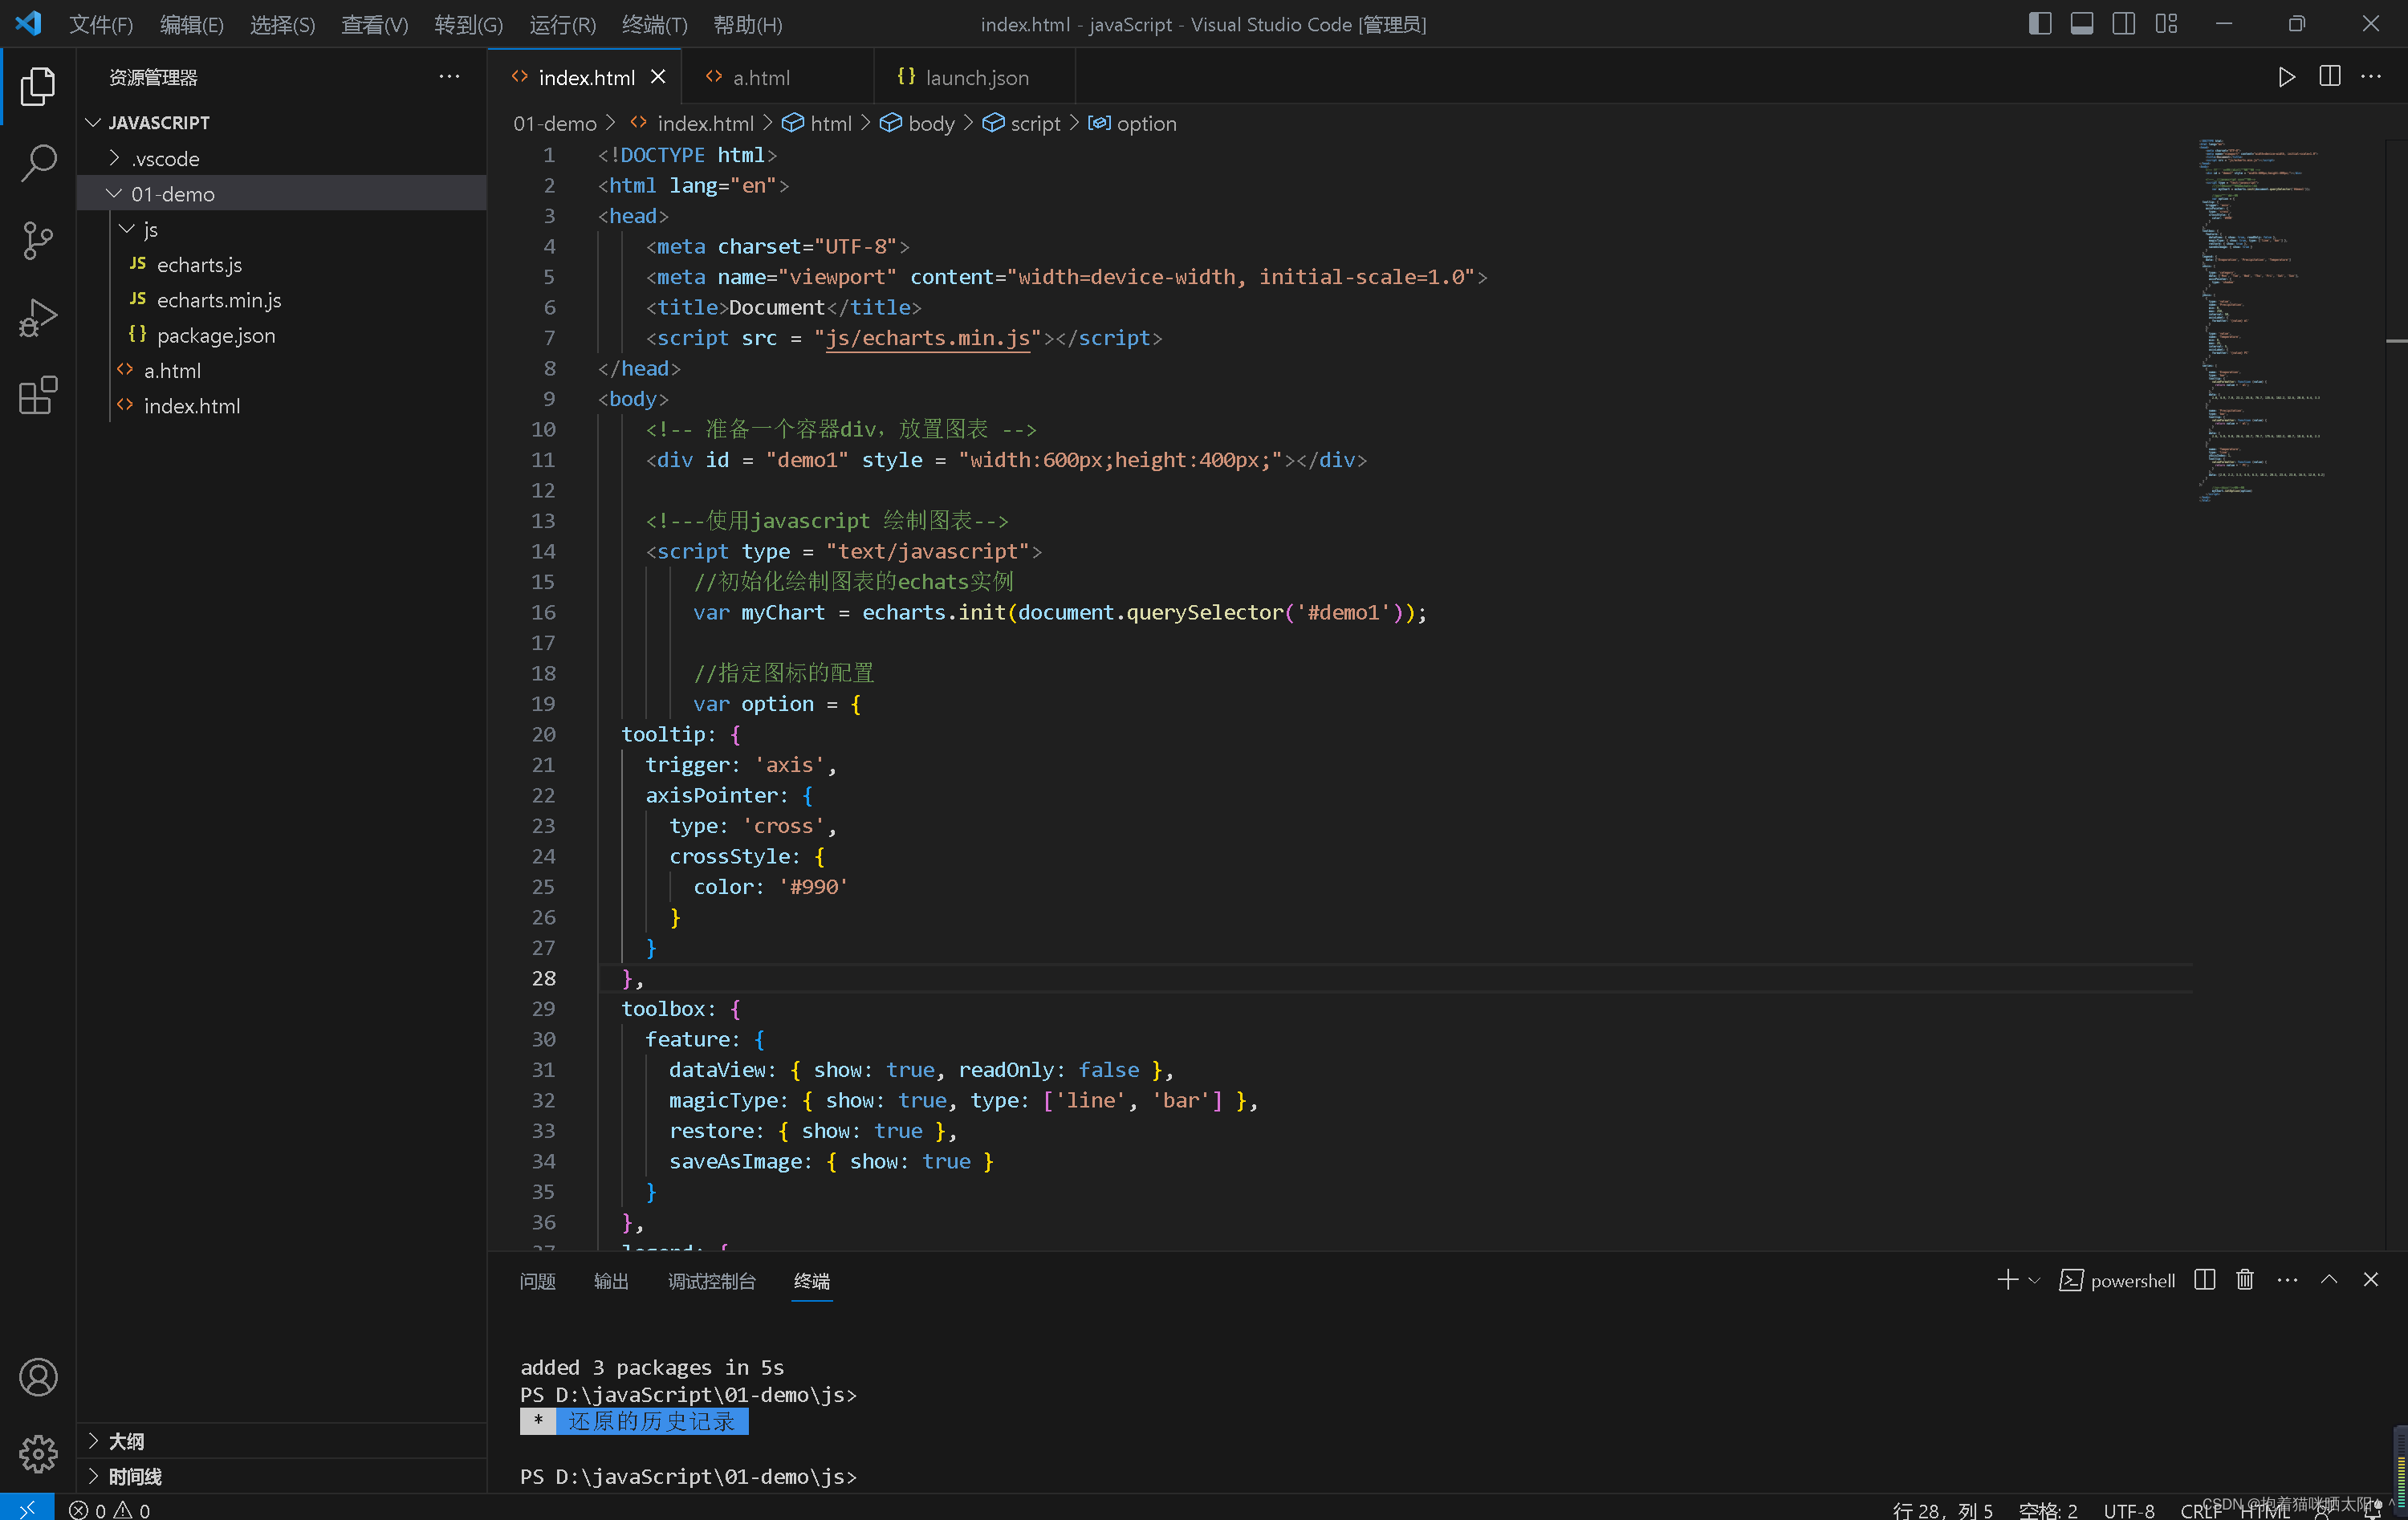
一直以为是环境配置的问题,改了一晚上vscode和浏览器Edge的各种配置,终于找到导致html空白的原因,其实问题还是出在代码上,下面是一个案例的正确代码,直接运行就可以出结果:
另外,还要注意html在与导入的含有echarts.min.js文件在同一个文件夹下:
<!DOCTYPE html>
<html lang="en">
<head>
    <meta charset="UTF-8">
    <meta name="viewport" content="width=device-width, initial-scale=1.0">
    <title>Document</title>
    <script src = "js/echarts.min.js"></script>
</head>
<body>
    <!-- 准备一个容器div,放置图表 -->
    <div id = "demo1" style = "width:600px;height:400px;"></div>

    <!---使用javascript 绘制图表-->
    <script type = "text/javascript">
        //初始化绘制图表的echats实例
        var myChart = echarts.init(document.querySelector('#demo1'));

        //指定图标的配置
        var option = {
  tooltip: {
    trigger: 'axis',
    axisPointer: {
      type: 'cross',
      crossStyle: {
        color: '#990'
      }
    }
  },
  toolbox: {
    feature: {
      dataView: { show: true, readOnly: false },
      magicType: { show: true, type: ['line', 'bar'] },
      restore: { show: true },
      saveAsImage: { show: true }
    }
  },
  legend: {
    data: ['Evaporation', 'Precipitation', 'Temperature']
  },
  xAxis: [
    {
      type: 'category',
      data: ['Mon', 'Tue', 'Wed', 'Thu', 'Fri', 'Sat', 'Sun'],
      axisPointer: {
        type: 'shadow'
      }
    }
  ],
  yAxis: [
    {
      type: 'value',
      name: 'Precipitation',
      min: 0,
      max: 250,
      interval: 50,
      axisLabel: {
        formatter: '{value} ml'
      }
    },
    {
      type: 'value',
      name: 'Temperature',
      min: 0,
      max: 25,
      interval: 5,
      axisLabel: {
        formatter: '{value} °C'
      }
    }
  ],
  series: [
    {
      name: 'Evaporation',
      type: 'bar',
      tooltip: {
        valueFormatter: function (value) {
          return value + ' ml';
        }
      },
      data: [
        2.0, 4.9, 7.0, 23.2, 25.6, 76.7, 135.6, 162.2, 32.6, 20.0, 6.4, 3.3
      ]
    },
    {
      name: 'Precipitation',
      type: 'bar',
      tooltip: {
        valueFormatter: function (value) {
          return value + ' ml';
        }
      },
      data: [
        2.6, 5.9, 9.0, 26.4, 28.7, 70.7, 175.6, 182.2, 48.7, 18.8, 6.0, 2.3
      ]
    },
    {
      name: 'Temperature',
      type: 'line',
      yAxisIndex: 1,
      tooltip: {
        valueFormatter: function (value) {
          return value + ' °C';
        }
      },
      data: [2.0, 2.2, 3.3, 4.5, 6.3, 10.2, 20.3, 23.4, 23.0, 16.5, 12.0, 6.2]
    }
  ]
};
        //对实例对象设置配置
        myChart.setOption(option)
    </script>
</body>
</html>


 被折叠的 条评论
为什么被折叠?
被折叠的 条评论
为什么被折叠?
 到【灌水乐园】发言


