


tmap工具包的名称是Thematic Maps的缩写,是R中专门绘制地图的工具包。该包语法与ggplot2包比较类似,都是通过符合+来进行图层叠加。
加载示例数据:
library(tidyverse)
library(sf)
usa <- albersusa::counties_sf(proj = "laea") %>%
  mutate(fips = as.character(fips)) %>%
  left_join(socviz::county_data, by = c("fips" = "id"))
加载工具包:
library(tmap)
该包加载极为费时,需要耐心等待。
我们首先来绘制一幅重分类地图。
tamp中与绘图相关的函数都是以tm或tmap作为前缀进行命名的。tm_shape函数的功能类似于ggplot2包中的ggplot函数,用来导入地图数据,不同点是在一幅图中tm_shape可以多次使用。
导入地图数据后,就可以使用tm_fill函数进行重分类绘图了,该函数的几个主要参数如下:
col:填充变量或颜色
alpha:透明度
palette:填充颜色
n:重分类数量,默认为5
style:重分类方式,可选项有 cat(分类变量)、 fixed(手动)、sd、equal(等间距)、 pretty、 quantile(等分位)、 kmeans、hclust、bclust、fisher、 jenks、dpih、 headtails、log10_pretty
break:当style = "fixed"时,使用该参数指定分类区间
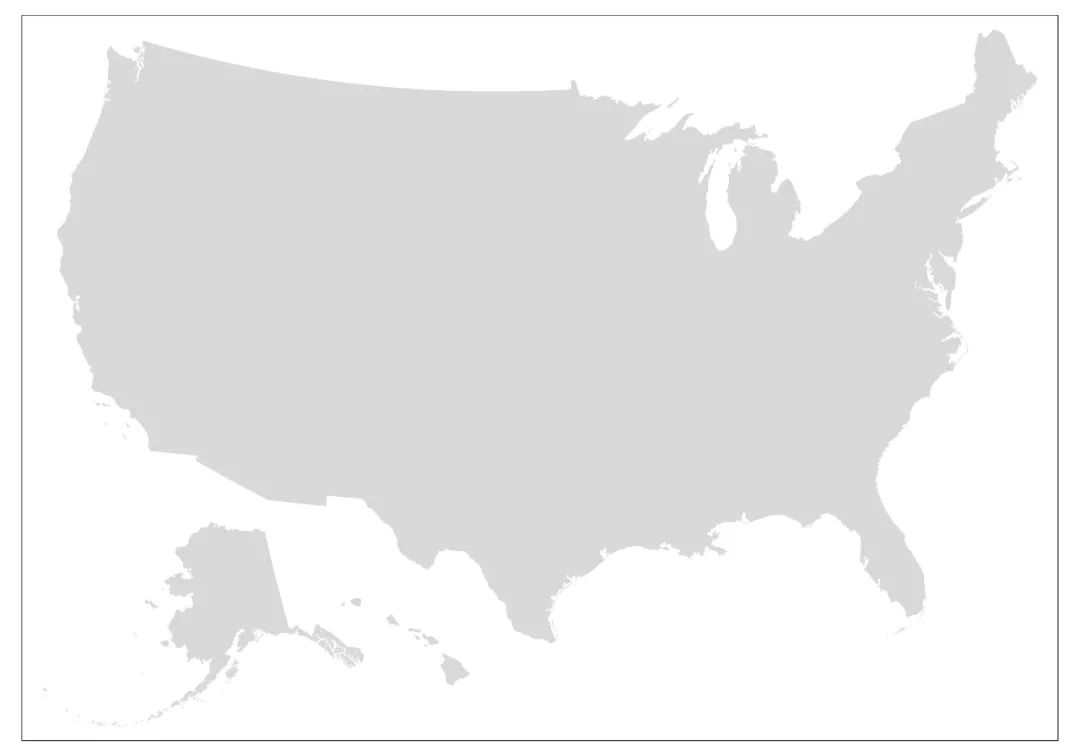
不设置任何参数:
map00 <- tm_shape(usa) +
  tm_fill()
tmap_save(map00, "42-0.jpeg", dpi = 600)
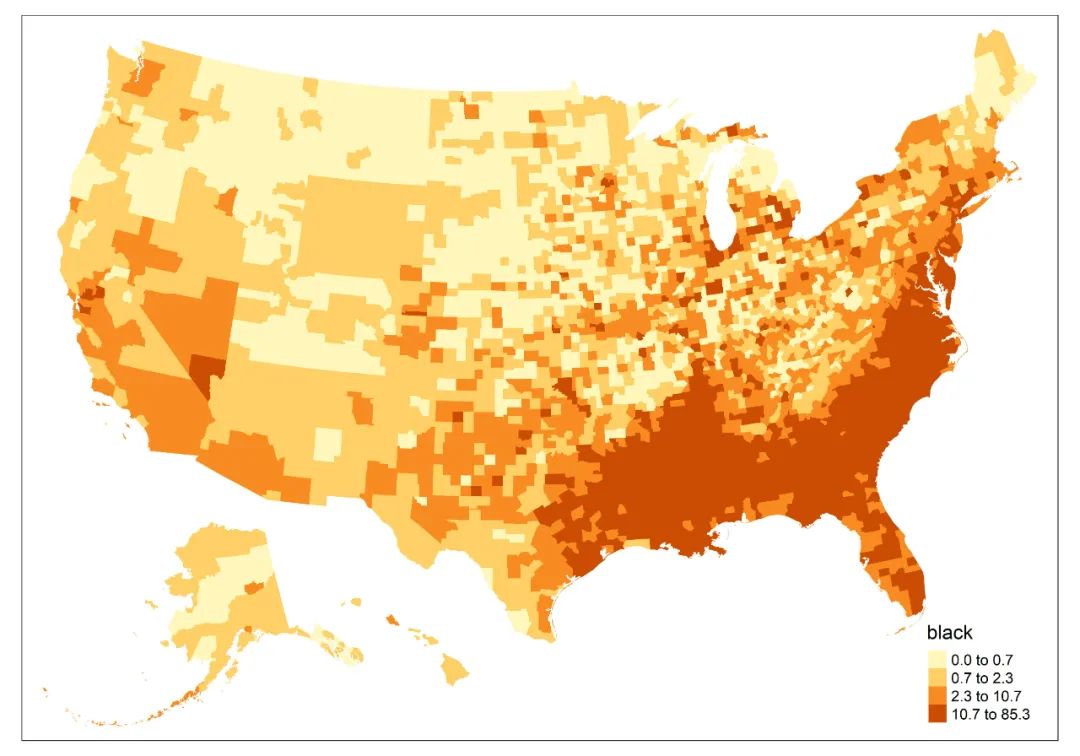
以黑人占比变量black为重分类依据:
map01 <- tm_shape(usa) +
  tm_fill(col = "black", style = "quantile", n = 4)
tmap_save(map01, "42-1.jpeg", dpi = 600)
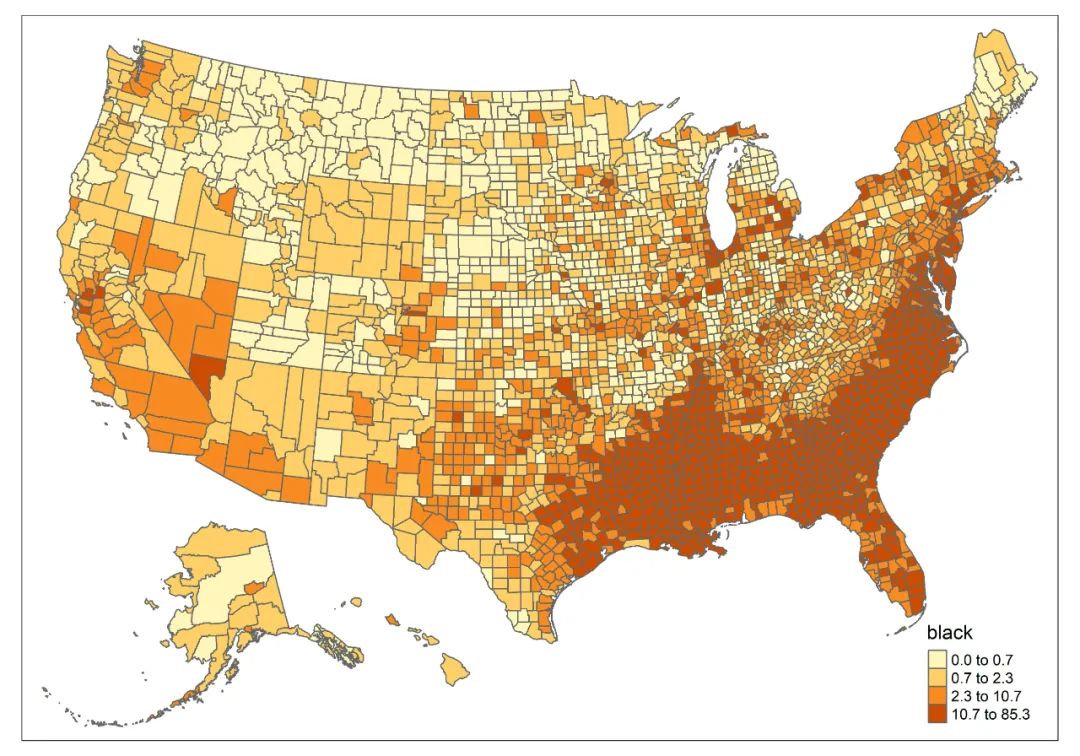
tm_fill函数只负责填充空间单元内部的颜色,如果要加上边界,可以使用tm_polygons函数代替:
map02 <- tm_shape(usa) +
  tm_polygons(col = "black", style = "quantile", n = 4)
tmap_save(map02, "42-2.jpeg", dpi = 600)
或者在tm_fill函数的基础上再叠加tm_borders函数:
tm_shape(usa) +
  tm_fill(col = "black", style = "quantile", n = 4) +
  tm_borders(col = "black")
由于县级单元的边界太密,可以使用州边界,还可以使用点的大小标记各州的人口规模pop:
tm_bubbles:使用点状要素表达变量大小
# from county to state
usa.state <- group_by(usa, state_fips) %>%
  summarise(pop = sum(pop))
st_write(usa.state, "G:/usa.state.shp", delete_layer = T)
usa.state <- st_read("G:/usa.state.shp")

map03 <- tm_shape(usa) +
  tm_fill(col = "black", style = "quantile", n = 4) +
  # 叠加tm_shape函数
  tm_shape(usa.state) +
  tm_borders(col = "black") +
  tm_bubbles(size = "pop", col = "white")
tmap_save(map03, "42-3.jpeg", dpi = 600)
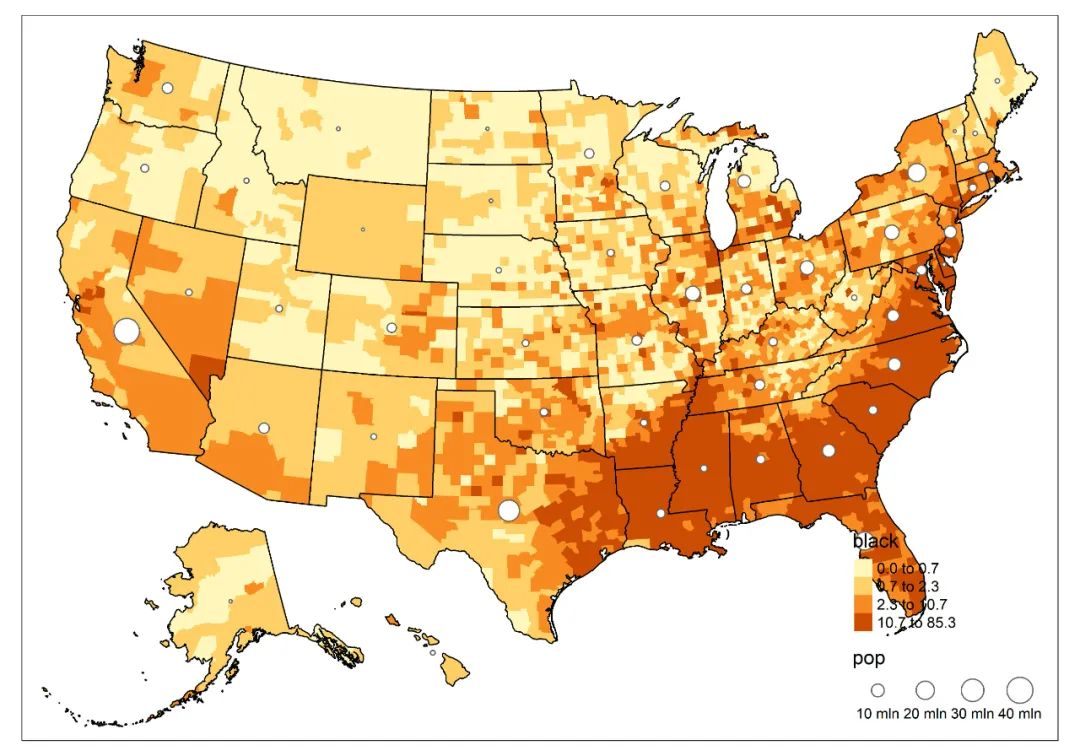
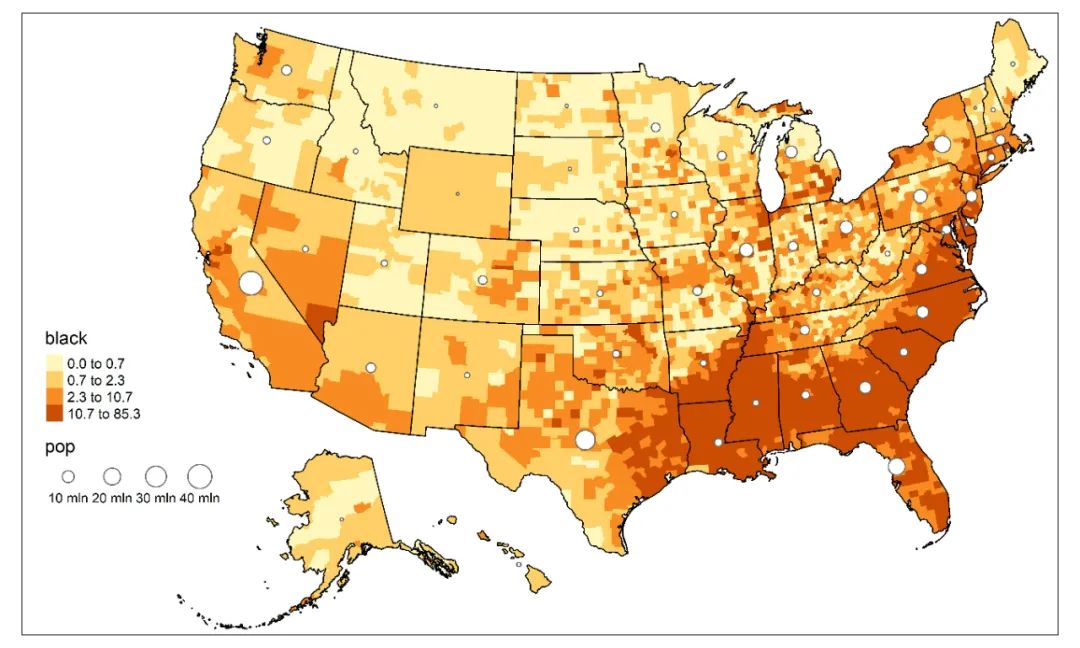
从上副图可以看出,图例与地图之间出现了重叠,可以使用tm_layout函数调整布局:
inner.margins:内边距(地图与边框四周的距离)
outer.margins:外边框(边框与页面四周的距离)
legend.position:图例位置
map04 <- tm_shape(usa) +
  tm_fill(col = "black", style = "quantile", n = 4) +
  tm_shape(usa.state) +
  tm_borders(col = "black") +
  tm_bubbles(size = "pop", col = "white") +
  tm_layout(inner.margins = c(0.01, 0.15, 0.01, 0.01),
            legend.position = c(0.02, 0.2))
tmap_save(map04, "42-4.jpeg", dpi = 600)
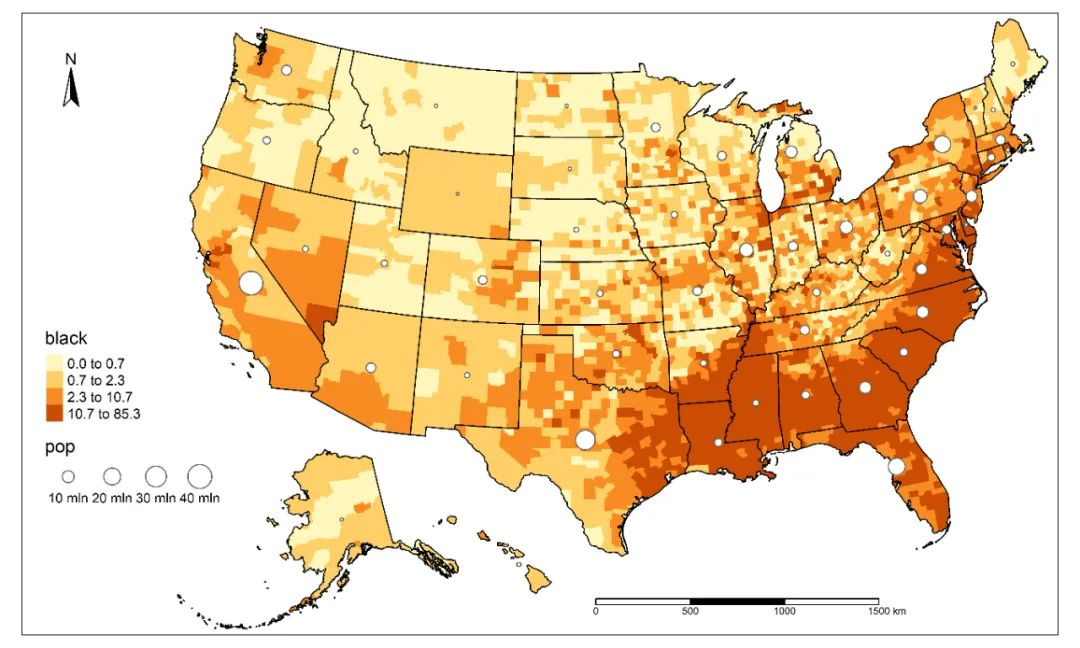
添加指北针和比例尺:
tm_scale_bar:添加比例尺
tm_compass:添加指北针
map05 <- tm_shape(usa) +
  tm_fill(col = "black", style = "quantile", n = 4) +
  tm_shape(usa.state) +
  tm_borders(col = "black") +
  tm_bubbles(size = "pop", col = "white") +
  tm_layout(inner.margins = c(0.01, 0.15, 0.01, 0.01),
            legend.position = c(0.02, 0.2)) +
  tm_scale_bar(position = c(0.55, 0.02)) +
  tm_compass(position = c(0.02, 0.85))
tmap_save(map05, "42-5.jpeg", dpi = 600)
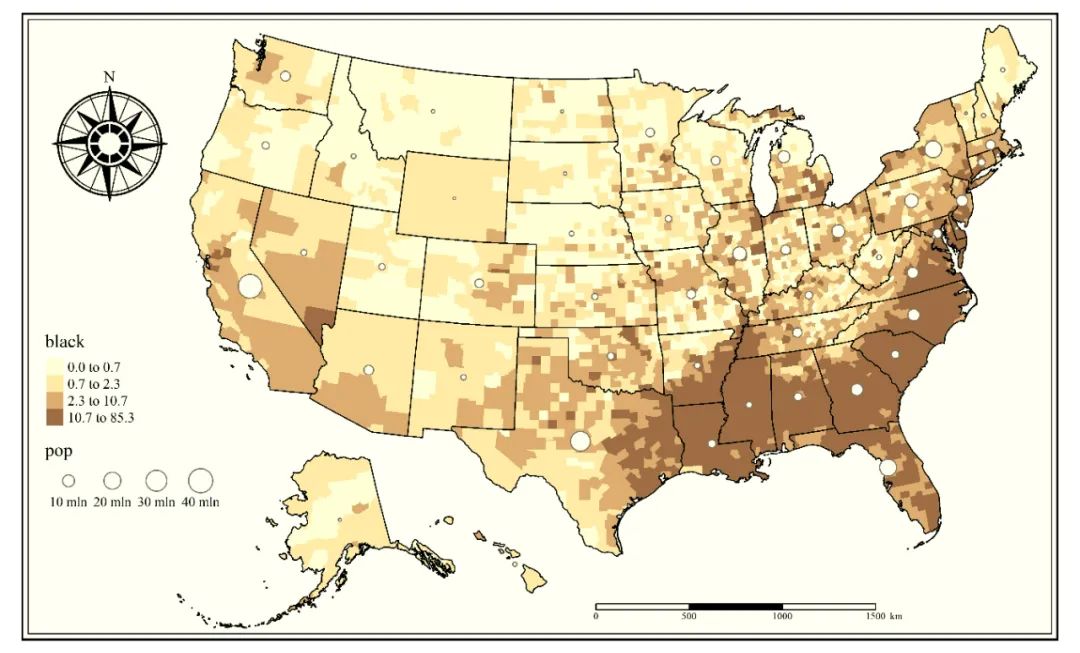
tmap工具包还提供了一些主题风格,如classic主题:
tmap_style:设置绘图风格
tmap_style("classic")
map06 <- tm_shape(usa) +
  tm_fill(col = "black", style = "quantile", n = 4) +
  tm_shape(usa.state) +
  tm_borders(col = "black") +
  tm_bubbles(size = "pop", col = "white") +
  tm_layout(inner.margins = c(0.02, 0.15, 0.02, 0.02),
            legend.position = c(0.02, 0.2)) +
  tm_scale_bar(position = c(0.55, 0.02)) +
  tm_compass(position = c(0.02, 0.7))

tmap_save(map06, "42-6.jpeg", dpi = 600)
# 返回默认主题风格
tmap_style("white")
主题风格一旦设置就会对所有
tmap对象起作用,如果只想对部分地图设置主题,在使用后可以通过tmap_style("white")返回默认主题。
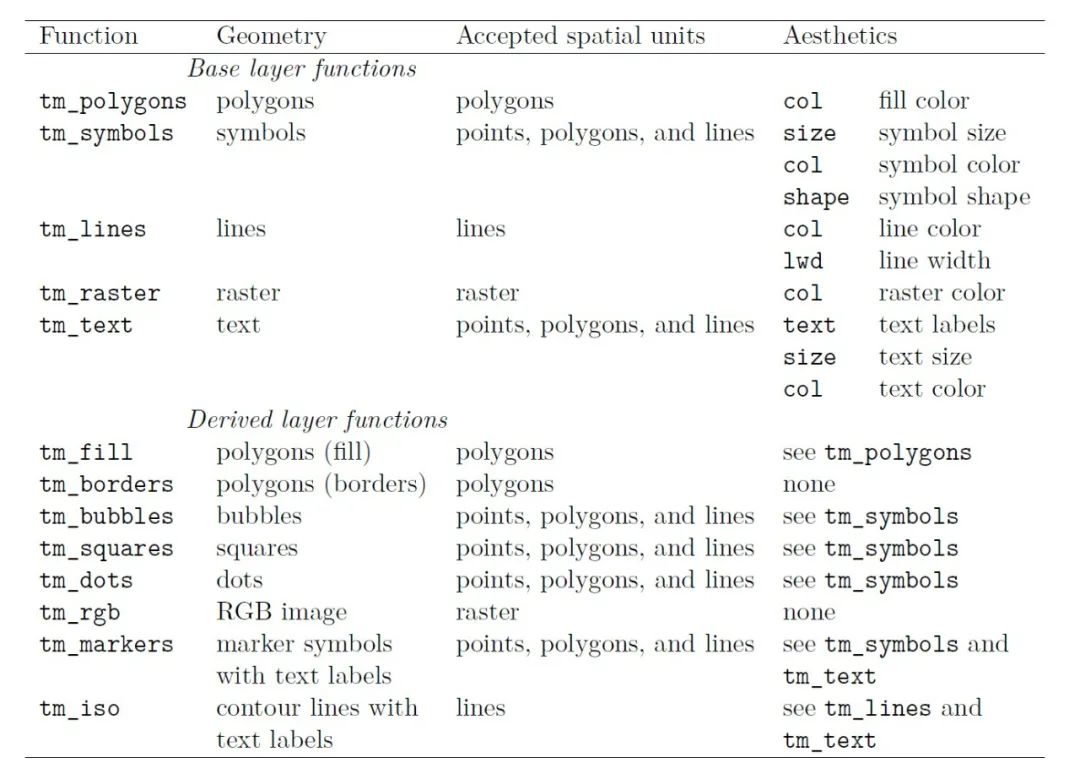
tmap包中主要绘图函数及其适用对象:
往期推荐阅读:


 994
994

 被折叠的 条评论
为什么被折叠?
被折叠的 条评论
为什么被折叠?
 到【灌水乐园】发言


