


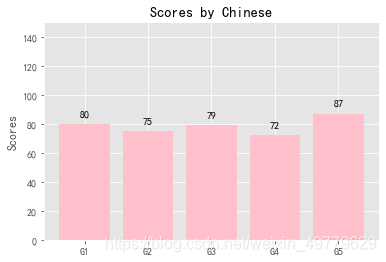
1.简单柱形图:
在柱形图上添加数值标签。
import matplotlib.pyplot as plt
# 中文显示处理
plt.rcParams['font.sans-serif'] = [u'SimHei']
plt.rcParams['axes.unicode_minus'] = False
# 设置绘图风格
plt.style.use('ggplot')

# 构造数据
c_means = [80, 75, 79, 72, 87]

# 绘图
plt.bar(range(5), c_means, align='center', color='pink', alpha=1)  # alpha:透明度
# 添加轴标签
plt.ylabel('Scores')
# 添加标题
plt.title('Scores by Chinese')
# 添加刻度标签
plt.xticks(range(5), ['G1', 'G2', 'G3', 'G4', 'G5'])
# 设置Y轴的刻度范围
plt.ylim([0, 150])
# 为每个柱形图添加数值标签
for x, y in enumerate(c_means):
    plt.text(x, y + 5, '%s' % round(y, 1), ha='center')
# 显示图形
plt.show()
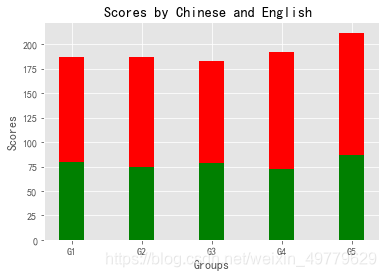
2.堆叠柱形图:
用堆叠柱状图比较各组Chinese和English间的成绩。
import matplotlib.pyplot as plt
# 设置绘图风格
plt.style.use('ggplot')

# G1,G2,G3,G4,G5 小组的分数。
labels = ['G1', 'G2', 'G3', 'G4', 'G5']
c_means = [80, 75, 79, 72, 87]
e_means = [107, 112, 104, 120, 125]

width = 0.35  # 图的宽度
fig, ax = plt.subplots()  # 创建一个窗口和一个子坐标系
ax.bar(labels, c_means, width, color='g')
# 将English分数柱形图堆在Chinese分数柱形图上方。
ax.bar(labels, e_means, width, color='r', bottom=c_means)

plt.xlabel('Groups')
plt.ylabel('Scores')
plt.title('Scores by Chinese and English ')
plt.show()
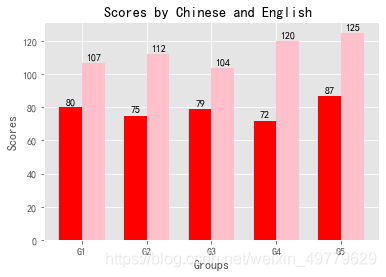
3.分组柱形图:
利用分组柱形图比较Chinese和English成绩在不同组中的差异。
import matplotlib.pyplot as plt
# 设置绘图风格
plt.style.use('ggplot')

# G1,G2,G3,G4,G5 小组的分数。
labels = ['G1', 'G2', 'G3', 'G4', 'G5']
c_means = [80, 75, 79, 72, 87]
e_means = [107, 112, 104, 120, 125]
x = np.arange(len(labels))
width = 0.35  # 图的宽度

fig, ax = plt.subplots()  # 创建一个窗口和一个子坐标系
rects1 = ax.bar(x - width / 2, c_means, width,
                color='r')  # x-width/2:计算出左边柱形图的位置。
rects2 = ax.bar(x + width / 2, e_means, width,
                color='pink')

ax.set_xticks(x)  # 设置具体刻度。
ax.set_xticklabels(labels)  # 设置刻度标签。

plt.xlabel('Groups')
plt.ylabel('Scores')
plt.title('Scores by Chinese and English ')


def autolabel(rects):
    """ 在每个柱形条上方添加一个文本标签显示"""
    for rect in rects:
        height = rect.get_height()  # 柱形条的高度。
        # annotate() 用于在图形上给数据添加文本注释。
        ax.annotate(
            '{}'.format(height),  # 注释文本内容
            xy=(rect.get_x() + rect.get_width() / 2,
                height),  # 被注释的坐标点:xy=(横坐标,纵坐标),即每个柱形条的顶部中心。
            xytext=(0, 3),  # 注释文本的坐标点(相对于被注释点取坐标):xytext(横坐标,纵坐标)。
            textcoords=
            "offset points",  # offset points:指偏移量,单位:点。
            ha='center')  # 注释居中


autolabel(rects1)
autolabel(rects2)
plt.show()
注:上述主程序来自于网络,本人练习改进。


 被折叠的 条评论
为什么被折叠?
被折叠的 条评论
为什么被折叠?
 到【灌水乐园】发言


